Introduction: The Eternal Challenge
Every investor faces the age-old challenge: How much risk should you take to get the returns you want? Some chase high returns and accept big swings in value, while others prefer a steadier, less volatile journey—even if it means settling for modest gains. Understanding the risk vs return trade-off in investing is the foundation for making confident, data-driven investment decisions.
What Is Risk in Investing?
Risk is the possibility that your investments won’t perform as you expect. In practical terms, it means you might not hit your financial goals—or worse, you could lose money. Here are the main types of risks investors encounter:
- Volatility: The degree to which an investment’s price moves up and down. Highly volatile assets can spike in value or plummet in short periods.
- Drawdowns: Significant, sustained drops in investment value—how much an asset or portfolio declines from its highest point before recovering.
- Downside Risk: The likelihood of suffering losses instead of gains, often shaped by unpredictable events or market downturns.
Types of Return: More Than Just the Bottom Line
Understanding “return” goes well beyond just watching your investment account balance grow. Knowing the different ways returns are measured can help you compare opportunities properly and set realistic expectations for your portfolio. Let’s dive deeper into each key type of return:
Nominal Return is the most straightforward calculation—it’s the total percentage increase (or decrease) in your investment’s value over a given period, without adjusting for any external factors. Think of this as the “headline” rate you might see in brokerage statements or fund marketing materials. However, nominal return doesn’t account for any deductions, such as management fees, taxes, or the eroding effect of inflation. For example, if you invested $10,000 and it grows to $11,000 over a year, your nominal return is 10%. But this number alone doesn’t show your actual profit after all costs and inflation are considered.
Real Return takes the next step by factoring in inflation—the general increase in prices over time that reduces your money’s purchasing power. This adjustment provides a clearer picture of how much your wealth has grown in terms of actual buying power. Using the earlier example: if your nominal return is 10% but inflation was 3% during the same period, then your real return is roughly 7%. Real returns help you assess whether your investments are truly growing after considering rising living costs, not just nominally increasing in dollar terms. Diversiview allows users to set their own return expectations for simulation, to learn more see how to Analyse Your Portfolio with Your Expected Returns.
Absolute Return shows your investment’s total gain or loss over a specific time frame, regardless of how the broader market performed. It answers the question: “How much did I make or lose in total?” Absolute return is helpful for evaluating standalone performance, such as the return on a property investment over three years, or your entire portfolio’s gain in a calendar year. This measurement doesn’t compare your result to any benchmark; it gives the raw number you experienced—useful for goal-based investors or when assessing individual strategies.
Relative Return is about context. It compares your investment’s performance to a benchmark, such as a major stock index, a peer fund, or a specific target. For example, if your portfolio returned 8% while the benchmark returned 5%, your relative return is +3%. Conversely, if your investment lagged behind the benchmark, your relative return is negative. Relative return is often used by fund managers and analysts to judge whether an investment is “beating the market” or underperforming. It’s especially relevant if you’re selecting investments based on manager skill or competitive performance. Additional metrics like the Sharpe ratio, which considers both returns and risk, provide deeper insights into risk-adjusted outperformance. (For more on this, see our help page about the Sharpe ratio).
Each type of return tells a unique part of your investment story. By understanding the difference between nominal, real, absolute, and relative returns, you’ll be better equipped to evaluate strategies, set expectations, and make decisions that truly align with your financial goals.
Tip: A 7% nominal return in a year when inflation runs at 6% leaves you with just a 1% real return—much less impressive than it appeared at first glance.
Investment Risk vs Return — A Simple Example
To show how investments can differ in both risk and return, let’s look at 20 of the most popular trades from Australian Sharesight Users in July, 2025. For each holding, we’ve plotted the expected return (what you might expect to earn each year based on the past 3 years) against volatility (how much the price has moved up or down over that period).
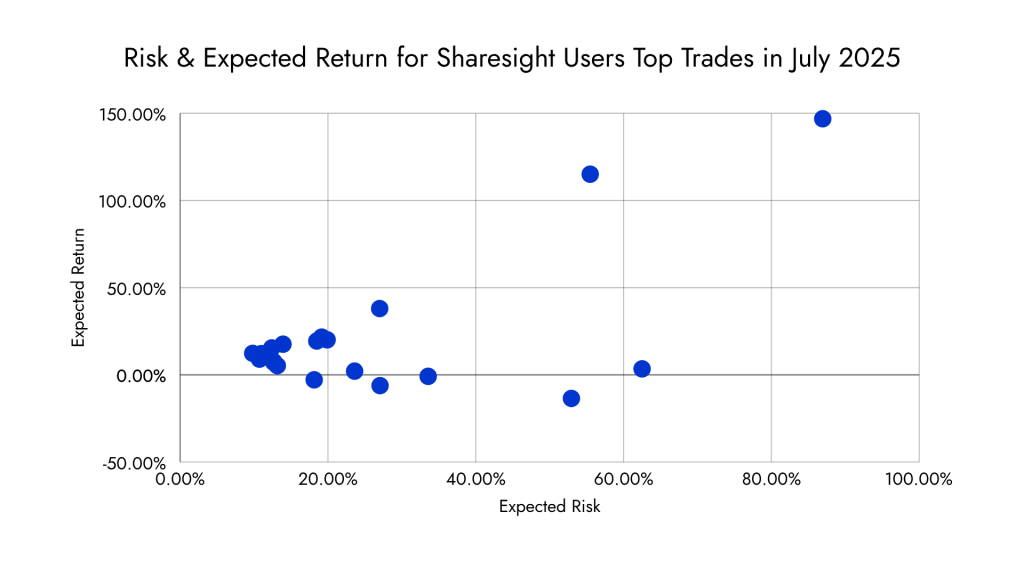
Here’s the data for those popular trades, which cover a mix of stocks and ETFs:
| Name | Ticker | Expected Return (Historical) | Volatility |
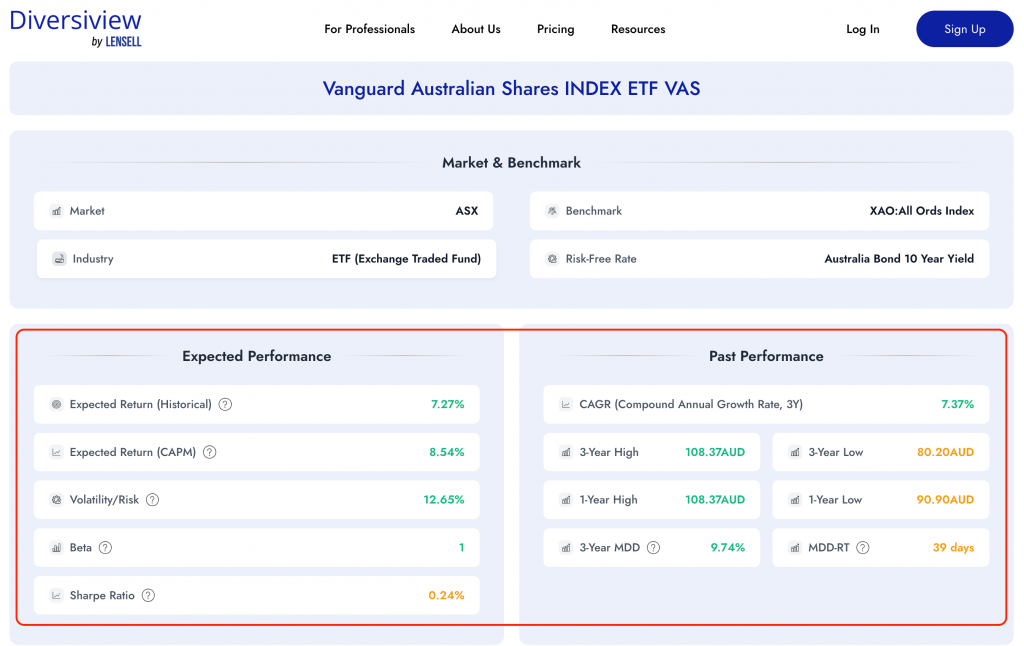
| Vanguard Australian Shares Index ETF | VAS | 7.27% | 12.65% |
| Vanguard Msci Index International Shares ETF | VGS | 15.44% | 12.41% |
| Ishares S&P 500 ETF | IVV | 17.58% | 13.92% |
| Betashares Nasdaq 100 ETF | NDQ | 21.66% | 19.16% |
| Vanguard Diversified High Growth Index ETF | VDHG | 8.98% | 10.74% |
| Betashares Australia 200 ETF | A200 | 7.52% | 12.67% |
| Betashares Diversified All Growth ETF | DHHF | 12.17% | 10.99% |
| Vanguard Australian Shares High Yield ETF | VHY | 5.29% | 13.15% |
| NVIDIA Corp | NVDA | 115.06% | 55.48% |
| Bhp Group Limited | BHP | 2.11% | 23.61% |
| Droneshield Limited | DRO | 146.85% | 86.94% |
| Vngd All World Ex Us | VEU | 12.35% | 9.82% |
| Tesla Inc | TSLA | 3.45% | 62.50% |
| Csl Limited | CSL | -2.84% | 18.14% |
| Pilbara Min Ltd | PLS | -13.52% | 52.94% |
| Betashares Global Cybersecurity ETF | HACK | 20.12% | 19.89% |
| Fortescue Ltd | FMG | -0.85% | 33.56% |
| Global X Fang+ ETF | FANG | 38.02% | 27% |
| Woodside Energy | WDS | -6.18% | 27.05% |
| Commonwealth Bank. | CBA | 19.39% | 18.49% |
These numbers come from Diversiview, which calculates:
- Expected Return – the annualised average return from the past three years of daily price data.
- Volatility (risk) – how much the price moves around its average return. Higher volatility means bigger swings (both up and down), which increases the risk of loss during downturns.
When you plot these on a Risk vs Return scatter chart, you can see some patterns emerge:
- Higher returns generally come with higher volatility (e.g., DRO and NVDA).
- Low‑risk investments tend to have more modest returns (e.g., large diversified ETFs like VEU or VDHG).
- Both individual stocks and ETFs vary widely in their profiles — even within the same asset class.
That’s why it’s important to measure both risk and return before investing. Tools like Diversiview make this easier by letting you test different securities and analyse portfolio combinations so you can choose investments that match your level of risk.
Why This Trade-Off Matters in Portfolio Construction
- Personal Goals: Your risk tolerance, how much loss or volatility you can accept, should drive your asset mix. Young investors with time on their side may opt for more risk; retirees generally seek stability in less volatile assets.
- Diversification: Combining assets with differing risk profiles can produce a more consistent and resilient investment journey. A well-diversified portfolio smooths out big swings and may boost your overall risk-adjusted return.
- Long-Term Mindset: Focusing solely on return can tempt you into risky bets; focusing only on minimising risk may lead to missed opportunities and underwhelming growth. Success lies in finding the right mix for you.
How to Analyse Risk vs Return Using Diversiview
Diversiview is built to help investors like you decode the risk vs return puzzle with research driven technology:
Risk vs Return at the investment level: Diversiview Stock Explore allows users to analyse key historical performance data like expected return, expected return (CAPM), volatility, Maximum Drawdown, key ratios and so much more.
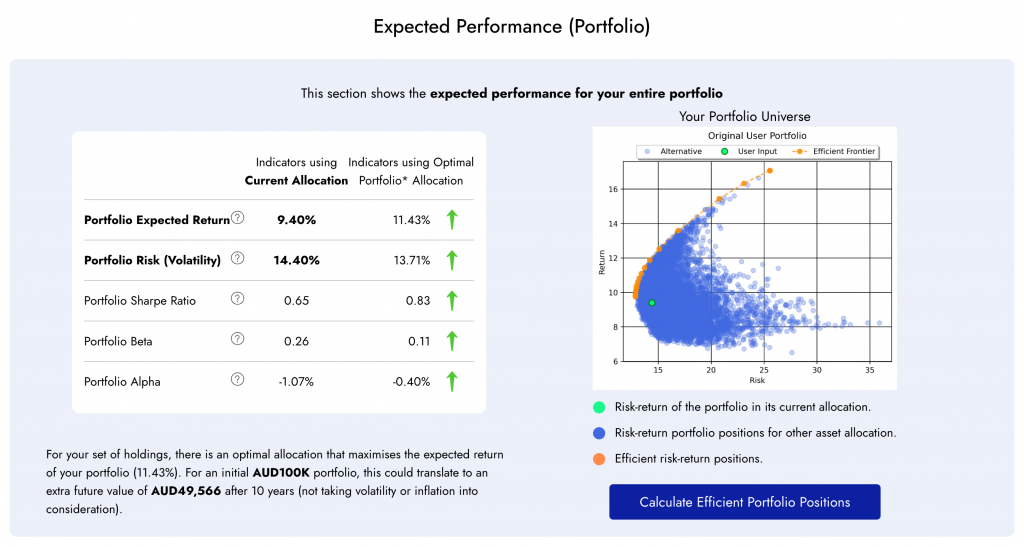
Risk vs Return at the portfolio level: Knowing the risk-return profile of individual investments is an important part of your journey. Diversiview calculates your entire portfolio’s risk-return profile giving you a holistic view of your portfolio.
Conclusion
The balance between risk vs return is the most important equation for every investor. By understanding your risk tolerance, your portfolio’s expected returns, and how your investments interact, you take control of your future.
Take control of your financial future! Open a free Diversiview account and get one FREE Portfolio Analysis, and discover how smart, data-driven decisions can help you understand the Risk vs Return Trade-Off in your portfolio.

Note: Diversiview does not provide financial advice or recommendations. Investment Portfolio Analyses are intended to provide investors with data driven insights and information. You should do your own further research, or speak with a licenced professional before making changes to your investment portfolio.