If you have an investment portfolio containing a mix of ETFs and individual stocks, there is always a possibility that some of your ETFs also contain some of your individual stocks, some ETFs may overlap, or some ETFs may contain stocks you don’t want to invest in.
In other words, your actual exposure to different individual stocks will be higher than you thought, or you may be overexposed to certain industries and underexposed to others.
Do you want more certainty about your investments?
It is always a good idea to know what you actually invest in, especially when you’re looking to invest in several ETFs along with several individually listed securities.
That is true no matter if you invest in one share market only or if you diversify internationally.
So, how to go about that?
Let’s look at an example and then we’ll show you where you find this information calculated for you in Diversiview.
Individual Stock Exposure example
Assume you have a portfolio with 3 stocks and 2 ETFs as follows: CBA (20%), BHP (30%), RIO (20%), ETF1 (15%), ETF2 (15%).
The high level asset type / industry allocation is as below:
| CBA | 20 | Banks |
| BHP | 30 | Materials |
| RIO | 20 | Materials |
| ETF1 | 15 | ETF (Exchange Traded Fund) |
| ETF2 | 15 | ETF (Exchange Traded Fund) |
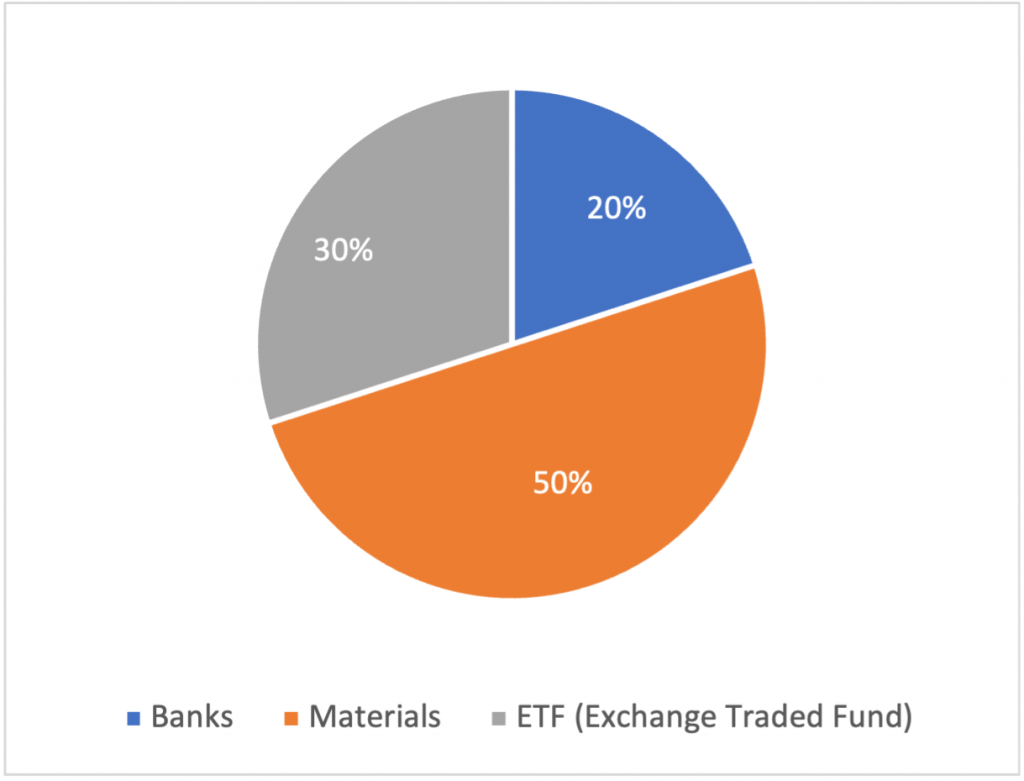
Many investment platforms and trading application will only show you the above piechart with the high level allocation.
But is that enough for you to understand your real investment exposure to all the risk and growth opportunities that are linked to the underlying holdings?
Assume that ETF1 is a global fund, containing: MSFT (10%), APPL (10%), BHP (10%), RIO (5%), COL (20%), WES (45%).
Also assume that ETF2 is an Australian fund containing: MQG (30%), BHP (20%), CSL (10%), COL (20%), CBA (20%).
As you can see, in this small example BHP appears in both ETFs, while CBA and RIO appear in one ETF each.
If we calculate the individual exposure for each stock considering the ETF compositions as described above, we obtain:
| Stock | raw% | calc% | Industry | |
| CBA | 20 | 20 | Banks | |
| BHP | 30 | 30 | Materials | |
| RIO | 20 | 20 | Materials | |
| ETF1 | MSFT | 10 | 1.5 | US Information Technology |
| 15% | AAPL | 10 | 1.5 | US Information Technology |
| BHP | 10 | 1.5 | Materials | |
| RIO | 5 | 0.75 | Materials | |
| COL | 20 | 3 | Consumer Staples Distribution & Retail | |
| WES | 45 | 6.75 | Consumer Discretionary Distribution & Retail | |
| ETF2 | MQG | 30 | 4.5 | Financial Services |
| 15% | BHP | 20 | 3 | Materials |
| CSL | 10 | 1.5 | Pharmaceuticals Biotechnology & Life Sciences | |
| COL | 20 | 3 | Consumer Staples Distribution & Retail | |
| CBA | 20 | 3 | Banks |
Based on the above calculations, the exposure to industry groups becomes:
| Banks | 23% |
| Consumer Discretionary Distribution & Retail | 6.75% |
| Consumer Staples Distribution & Retail | 6% |
| Financial Services | 4.50% |
| Materials | 55.25% |
| Pharmaceuticals Biotechnology & Life Sciences | 1.50% |
| US Information Technology | 3% |
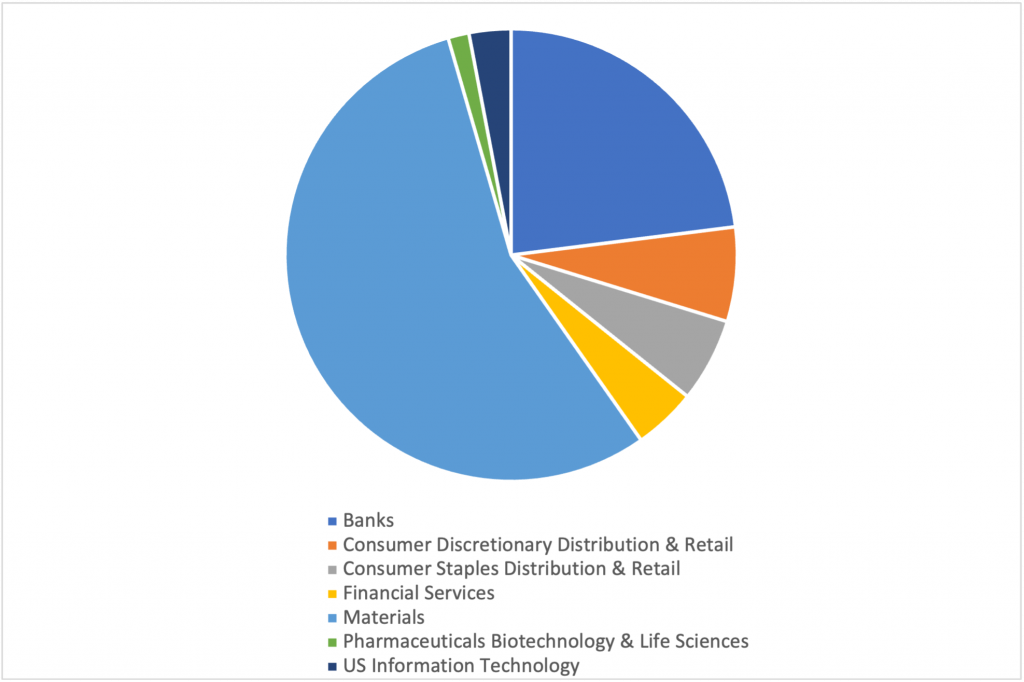
As one can notice, the exposure to Banks and Materials industry is actually higher than initially thought, and there is exposure to many other industry groups, in Australia and US.
What about the actual holdings?
By holding the two example ETFs in your portfolio, you actually hold the following individual securities:
AAPL | 1.50% |
| BHP | 34.50% |
| CBA | 23% |
| COL | 6% |
| CSL | 1.50% |
| MQG | 4.50% |
| MSFT | 1.50% |
| RIO | 20.75% |
| WES | 6.75% |
Individual Stock Exposure in Diversiview
The example above is very easy to figure out and calculate in a spreadsheet, once you have all the data you need including ETF holdings.
What if you have many ETFs, many overlapping stocks or no time to calculate?
Diversiview can help.
Simply enter you portfolio or upload from a CSV, click on “Get results” and Diversiview will show you the Individual stock exposure as a separate section at the top of the page, immediately after the Portfolio Composition section.
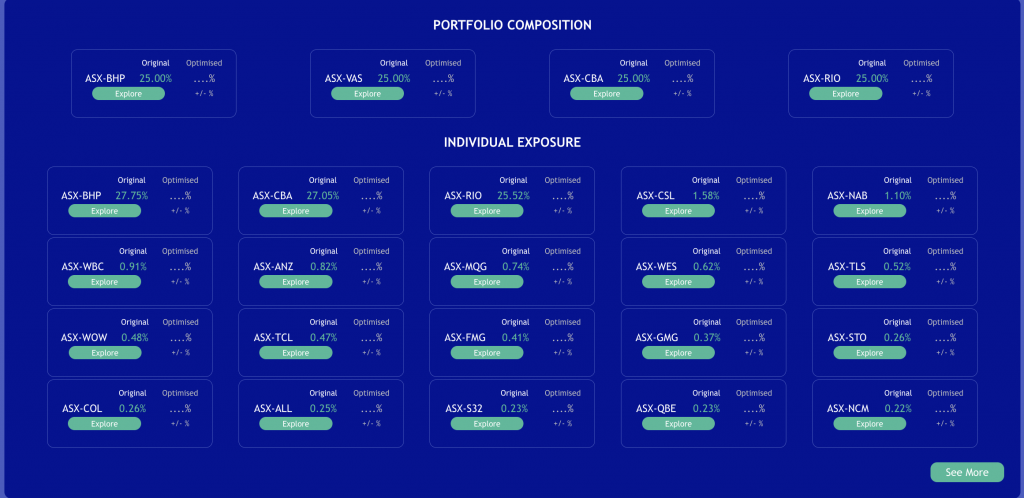
All individual holdings that are in your portfolio as part to your ETFs will be listed. The top 20 holdings are automatically shown, and you can click on “See more” to view all that have a weight higher than 0.01%.
Note that the individual stock exposure section will not appear if there are no ETFs in the portfolio or when Diversiview does not have the holdings data (check out the list of ETF with holdings available at current date).
If you have an ETF that is not in our list above, please contact us (email below) and we will be happy to add it.
Questions?
Please contact the team at hello@diversiview.online and we will be happy to help.