List and indicators valid as at 19 March 2026
With markets currently in turmoil and ongoing debate around the future prices of gold, silver, and other in-demand commodities, we set out to identify the top ASX-listed Materials securities: those offering strong return potential, lower volatility than the broader market, and solid performance over the past three years
We used StockLenz, our Quant-Driven Investment Research app, to find them.
In this example we filtered stocks in StockLenz for 5 criteria: market ASX, Industry Materials, Sharpe ratio > 1 (indicating good returns for investors for the level of risk taken), Beta < 1 (indicating lower volatility than the entire market) and CAGR > 20% (compound annual growth rate over the past 3 years)
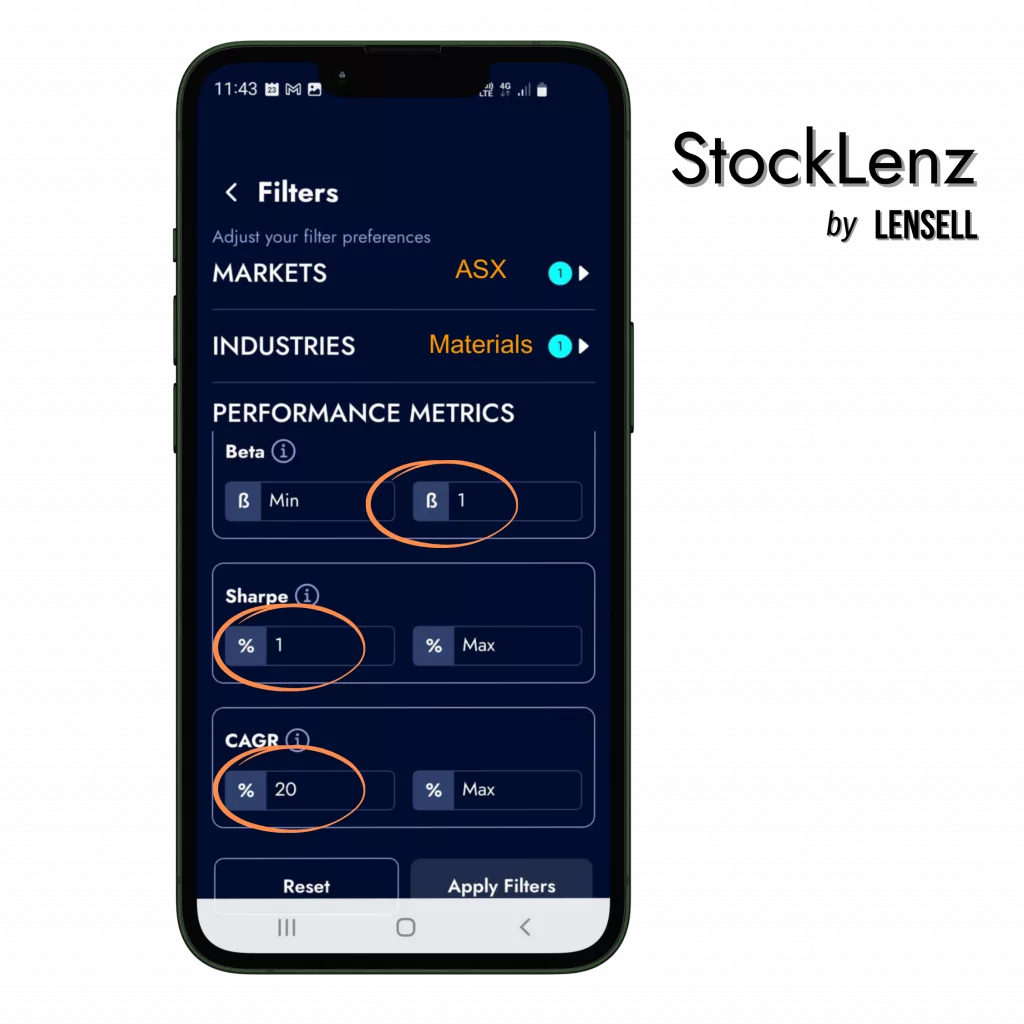
The screenshot above shows the indicators used for the example ranking. You can use the indicators and value ranges that makes sense for you.
The table below shows the first 5 results, sorted by CAGR.
The list (sorted by CAGR, ascending)
where market = ASX, industry = Materials, Sharpe>1, Beta < 1 and CAGR > 20%, as of 19 Mar 2026
| Ticker | Name | Focus | CAGR | Sharpe ratio | Beta | Expected Return (historical) | Volatility of returns |
| MAH | Macmahon Holdings | Mining Services | 67.42% | 1.22 | 0.91 | 65.99% | 50.53% |
| WGN | Wagners Holding Company Ltd | Construction & Building Materials | 91.60% | 1.56 | 0.63 | 89.53% | 54.57% |
| VYS | Vysarn Ltd | Water services and management | 101.90% | 1.67 | 0.76 | 99.55% | 57.21% |
| WIA | WIA Gold Ltd | Gold exploration | 116.05% | 1.34 | 0.55 | 113.3% | 81.19% |
| FML | Focus Minerals Ltd | Mining & explorations | 150.25% | 1.54 | 0.12 | 147.04% | 92.71% |
* Expected return calculated based on historical data, as geometric average of daily returns during the past 3 years, annualised. Volatility calculated as the standard deviation of daily returns, annualised. MDD and CAGR calculated over the past 3 years. Risk-free rate of return used for Sharpe 4.25% (Australian 10 year Treasury Bond yield at the date of the calculations).
Find your own preferred investments.
Install StockLenz today and run a search – it takes just seconds, and you can research and rank investments by any combination of quant indicators.
You can also save your favourites to your Diversiview account for further analysis.

NOTE: This article is not investment advice and does not constitute a recommendation to invest in any of the securities mentioned above. StockLenz is a quant driven research tool and the results will differ based on the data available, your filters and other indicators such as risk-free rates of return at the time of search. Please do your own research and/or speak with your financial advisor before making changes to your portfolio. Past performance does not guarantee future performance, and all investments carry a level of risk.
Disclaimer:
LENSELL GROUP Pty Ltd, ACN 646 467 941, trading as LENSELL, is a Corporate Authorised Representative of Foresight Analytics & Ratings Pty Ltd ( Australian Financial Services Licence No. 494552). All information provided to you by LENSELL is intended for general informational purposes only. It does not consider your individual financial circumstances and should not be relied upon without consulting a licensed investment professional or adviser.
The content on this website and in any of its applications is not a financial offer, recommendation, or advice to engage in any transaction. Investment products referenced in our software or marketing literature carry inherent risks, and you should note that past performance does not guarantee any future results. In all our modelling, no transaction costs or management fees are factored into performance analysis.
The information on our website or our mobile application is not intended to be an inducement, offer or solicitation to anyone in any jurisdiction in which LENSELL is not regulated or able to market its services.
Furthermore, all information used across our platform or website may be based on sources deemed reliable but is provided “as is” without guarantees of accuracy or updates. LENSELL and Foresight Analytics & Ratings disclaim all warranties and accepts no liability for any loss or damage resulting from use or reliance on any material or data embedded in our technology platform or digital media. Where liability cannot be excluded by law, it is limited to resupplying the information.
Please view our Financial Services Guide, Terms Of Service and Privacy Policy before making any investment decision using the information available on our website or on any of our applications. LENSELL, Diversiview and StockLenz are trademarks registered in Australia.