ETF stands for Exchange Traded Fund, and they funds that are traded on stocks exchanges similarly with individual stocks.
The difference is that an ETF contains a set of individual securities, that could be stocks, bonds, mutual funds, cash etc. The structure of each ETF is designed by their owner (fund manager) and it is usually quite diversified, looking to minimise the total volatility of the product by spreading the money across different asset types, industries or geographies, while also getting a good return.
With this in mind, how do you calculate the real asset allocation when you have a portfolio containing a mix of individual investments and ETFs? Some of your ETFs may contain some of the individual stocks you already have, in different percentages, or some of your ETFs may overlap with each other.
Diversiview helps with that and breaks up the ETFs into individual holdings, then calculates the real, granular industry exposure for your portfolio.
Example of Granular Allocation for portfolios with ETFs
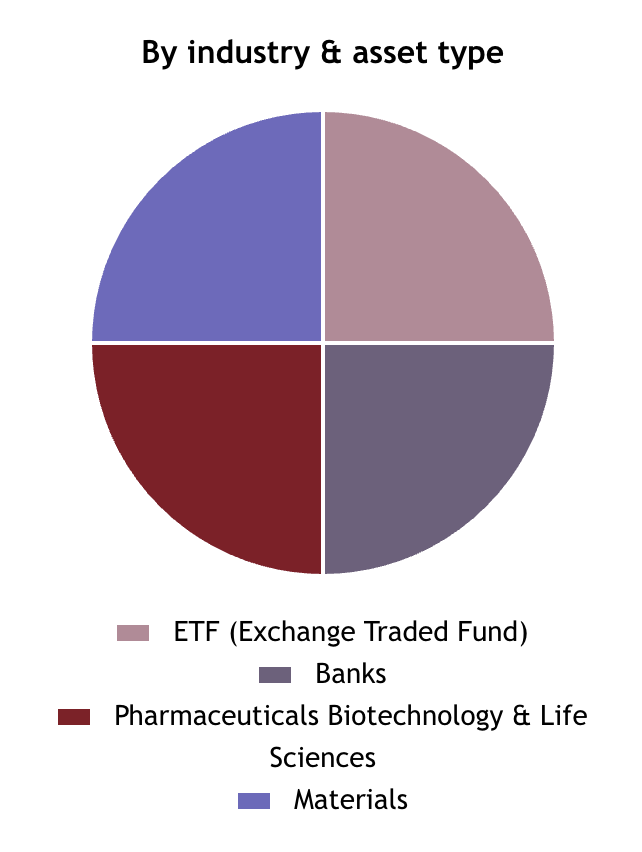
Assume you have a portfolio containing A200 (Betashares Australia 200 ETF), BHP, CSL and CBA, in equal percentages.
How much exposure (percentage wise) do you have to Banks?
The usual pie chart that you find on many platforms does not tell you the full story.
You do not have just 25% in Banks sectors as the piechart at the right shows.
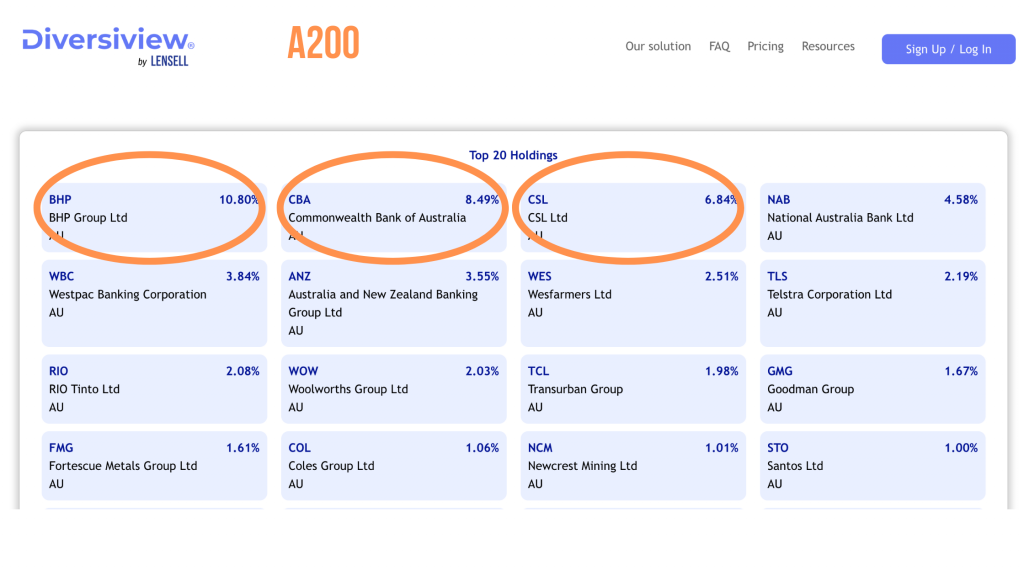
That is because CBA is also part of A200 in some measure (8.49%), and A200 may have exposure to other Australian banks as well.
At the same time, A200 also contains a bit of BHP (10.80%) and some CSL (6.84%) along with many other stocks.
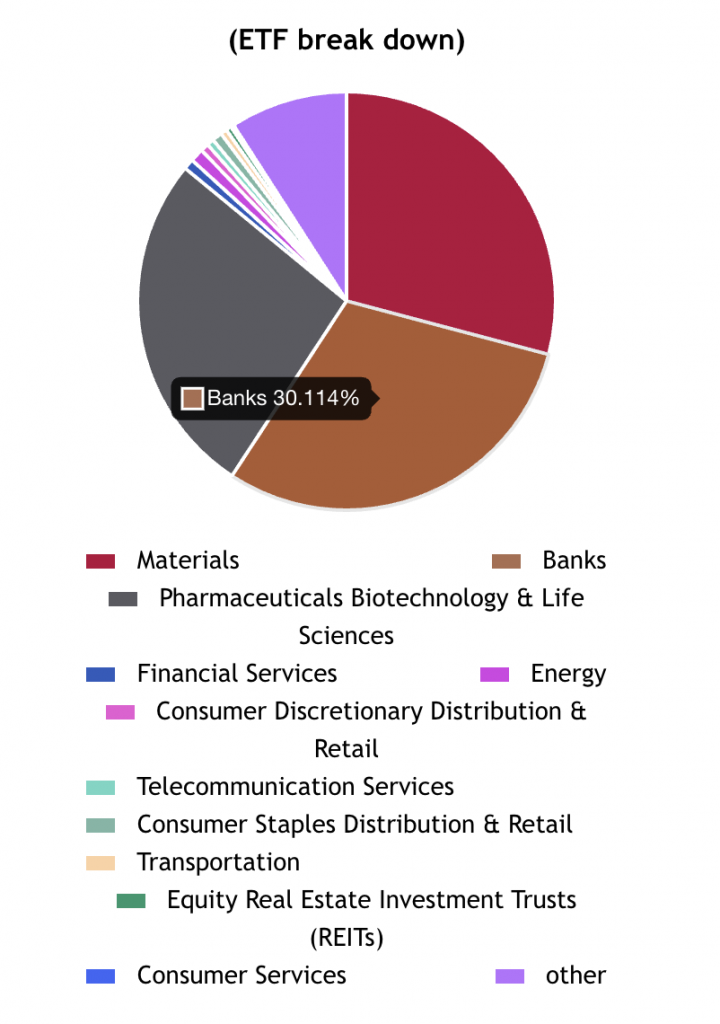
The correct exposure view is where the ETFs (in this example, A200) are broken down into individual holdings and added to your other individual holdings, with the exposure calculated overall.
As you can see, the exposure to Banks sectors in our example is actually 30.11%.
Transparency is key when you want to make informed decisions and having an understanding of your real exposure to different industry sectors or geographies is essential.
Diversiview helps you to calculate the granular allocation, and you can find the graphs on the analysis page under the Asset Allocation heading.
See the list of ETFs with individual holdings available in Diversiview, with more ETF compositions being added daily.
***
Give it a try now – it’s free to analyse portfolios with Diversiview!
If you have any questions please contact the team at hello@diversiview.online and we will be happy to help.