This case study explores the concept of portfolio rebalancing and its impact on portfolio performance. We will compare three allocation scenarios applied to a portfolio containing four popular Indian Mutual Funds (MFs). The analysis will cover a three-year period (June 2021 – June 2024) where the scenarios will begin with an equal allocation in 2021, allowing us to observe how each strategy handles market volatility year-over-year and ultimately influences the overall portfolio performance.
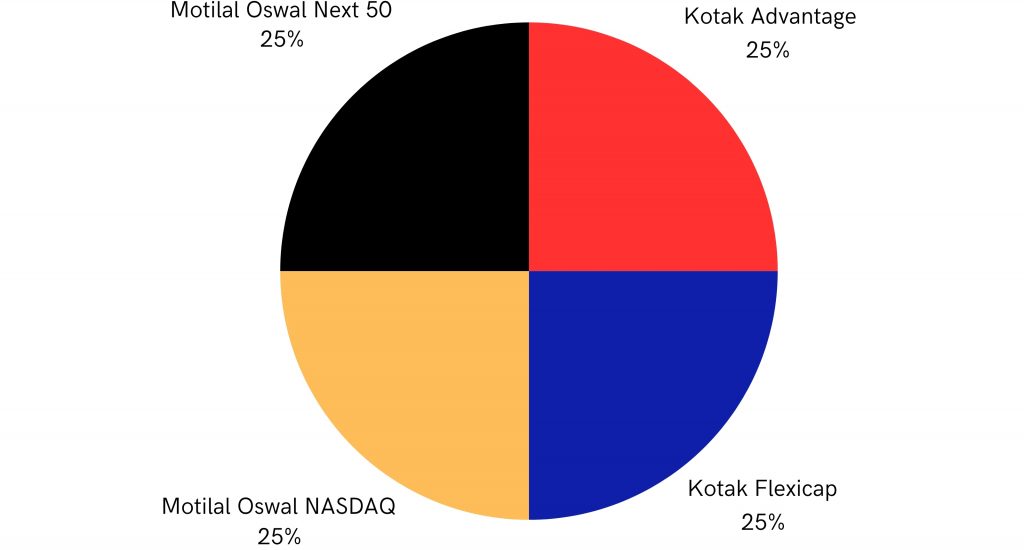
- Kotak Balanced Advantage Fund (INF174KA1186)
- Kotak Flexicap Fund (INF174K01336)
- Motilal Oswal NASDAQ 100 Fund of Fund (INF247L01700)
- Motilal Oswal Nifty Next 50 Index Fund (INF247L01AD9)
In this example, the Indian MFs portfolio was initially (June 2021) allocated as follows:
Indian MFs Strategy Backtesting
To ensure our analysis reflects real-world market conditions, we’ll utilise Diversiview’s strategy backtesting feature. This allows us to analyse the performance of the four chosen Indian mutual funds during the analysis period.
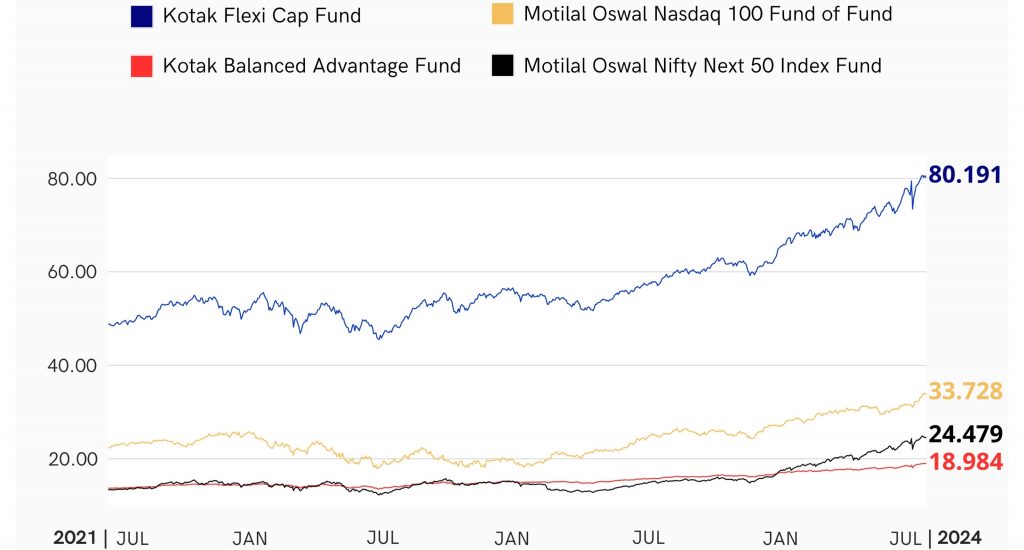
This data will then be used as the foundation for constructing two of the three allocation scenarios we’ll be exploring. Essentially, Diversiview will help us determine the optimal asset allocation based on the historical performance of these funds.
Indian MFs Portfolio Scenarios
In this example we look at 3 popular approaches:
Scenario A: Equal Allocation and Hold – This scenario involves purchasing an equal asset allocation and holding the portfolio without rebalancing.
Scenario B: Optimal Allocation in 2022 then Hold – This scenario starts with an equal allocation in June 2021 and then rebalanced to the optimal asset allocation with Diversiview in January 2022. This allocation is then held for the remainder of the analysis period.
Scenario C: Optimal Allocation Every Year – This scenario rebalances the portfolio to a new, calculated optimal allocation using Diversiview each year in January.
Key Differences Between Scenarios
The three scenarios differ in their level of portfolio management activity.
- Scenario A: Buy and hold requires no user intervention but allows allocations to drift from the target.
- Scenario B: Rebalances to the optimal allocation once before it is held, requiring no further user intervention.
- Scenario C: A more proactive approach rebalancing to an optimal allocation every year, offering the potential for improved performance by factoring in market fluctuations. While it requires more specialised skills, there are tools like Diversiview that can help you calculate your optimal portfolio allocation and send you alerts when the portfolios risk level fluctuates outside your comfort zone.
Scenario Asset Allocation Changes Scenario C Year-Over-Year (YoY)
The optimal allocation that the Indian MFs portfolio was rebalanced to was calculated by Diversiview using mathematical algorithms based on the Modern Portfolio Theory. The result is a potentially more efficient portfolio that adapts to changing market conditions.
As a result of the rebalancing, Scenario C is highlighted as it showcases the most dramatic changes in asset allocation:
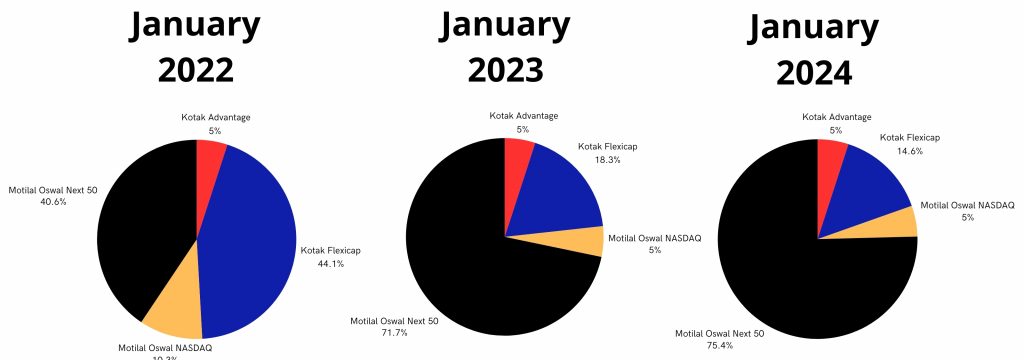
By comparing these pie charts, we can observe how the optimal asset allocation is adjusted year-over-year. This will provide valuable insights into how Scenario C actively seeks to optimise portfolio performance and increase expected returns.
In comparison, Scenario A held an initial equal asset allocation with minimal fluctuations over the 3 years, with the largest change being a couple of percentage points.
Similarly, Scenario B, after the initial optimisation in January 2022 (same asset allocation as Scenario C 2022), saw minimal changes whilst holding for the remainder of the analysis period, with the largest change being a couple of percentage points.
Scenario Comparison
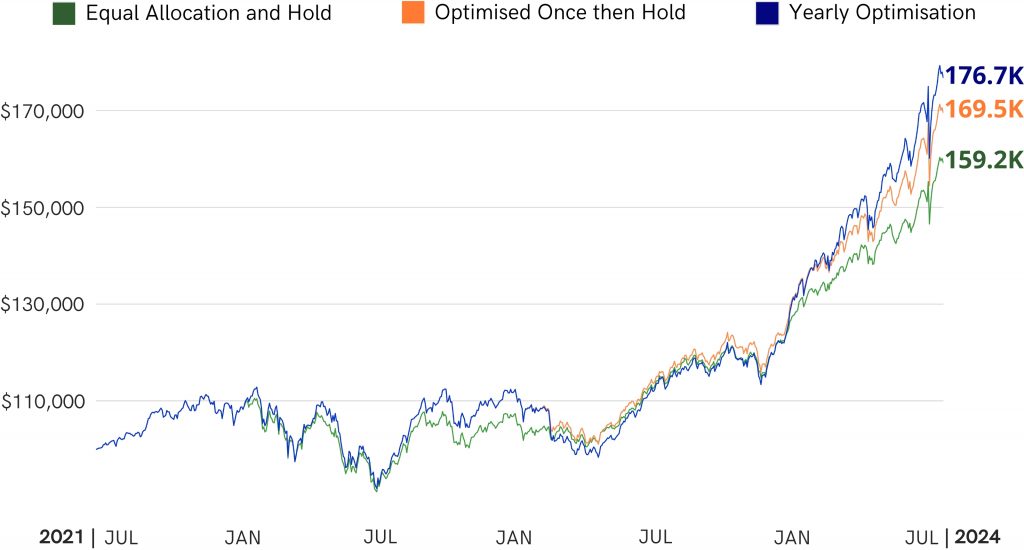
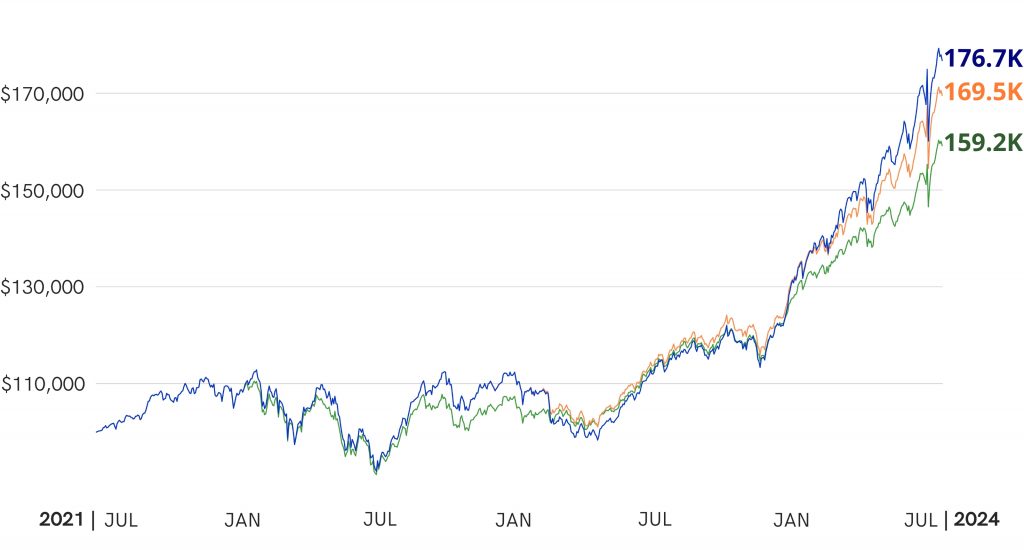
The line graph reveals a compelling story about the performance of each scenario over the three-year period, from a starting value of ₹1,00,000 in June 2021.
- Scenario A: The buy and hold approach achieved a final value of ₹1,59,200.
- Scenario B: Rebalancing to the optimal allocation once before it is held, resulted in a higher return over the 3 years compared to Scenario A, with a final value of ₹1,69,500.
- Scenario C: Notably, the rebalance to optimal allocation annually achieved the highest value of ₹1,76,700. This suggests that the dynamic rebalancing to the optimal asset allocation captured favorable market movements, ultimately leading to a higher overall portfolio value.
For Strategy B and C, transaction fees for buying and selling respective securities upon rebalancing were also considered.
How Diversiview Empowers You
Diversiview equips you with the tools to make informed investment decisions as showcased in this case study:
- Optimal Asset Allocation gives data-driven insight for allocating your funds across chosen investments, with the ideal balance between risk and return.
- Regular Rebalancing to optimal portfolio positions helps you stay on track by optimising your portfolio based on historical data.
- Portfolio Backtesting visualises the performance of your portfolio using your investment’s market fluctuations of the previous three years.
Don’t leave your portfolio’s potential to chance! Get a free Diversiview analysis today and experience the power of data-driven investing.
Disclaimer: This Indian Mutual Funds portfolio scenario comparison demonstrates the potential benefits of periodically rebalancing to the optimal portfolio allocation. Note that the results achieved are not guaranteed and may not apply to all portfolios. Regular optimisation is a valuable practice, however every portfolio is unique and the ideal frequency of optimisation will be different. Market conditions significantly impact performance. Diversiview helps you calculate efficient, optimised portfolio allocations that you can match to your specific risk tolerance and investment goals.