This case study examines the effectiveness of Diversiview’s portfolio optimisation tools in a real-world scenario.
A Diversiview user, Robins Joseph from myguide2wealth analysed and optimised their portfolio on February 2, 2024. Robins utilised Diversiview’s sophisticated algorithms to calculate the expected performance of his portfolio and optimise its asset allocation for a better expected outcome (for the full holdings list click here):
Portfolio Universe™
First, Robins wanted to understand what his portfolio’s expected performance was on that date.
With Diversiview’s ‘Portfolio Universe™’, Robins was able to easily visualise his portfolio expected risk-return position, and compare it to thousands of other potential positions.
Robins’ original portfolio allocation position can be seen below with an expected return of 18.9% and risk (volatility) of 34.80%:
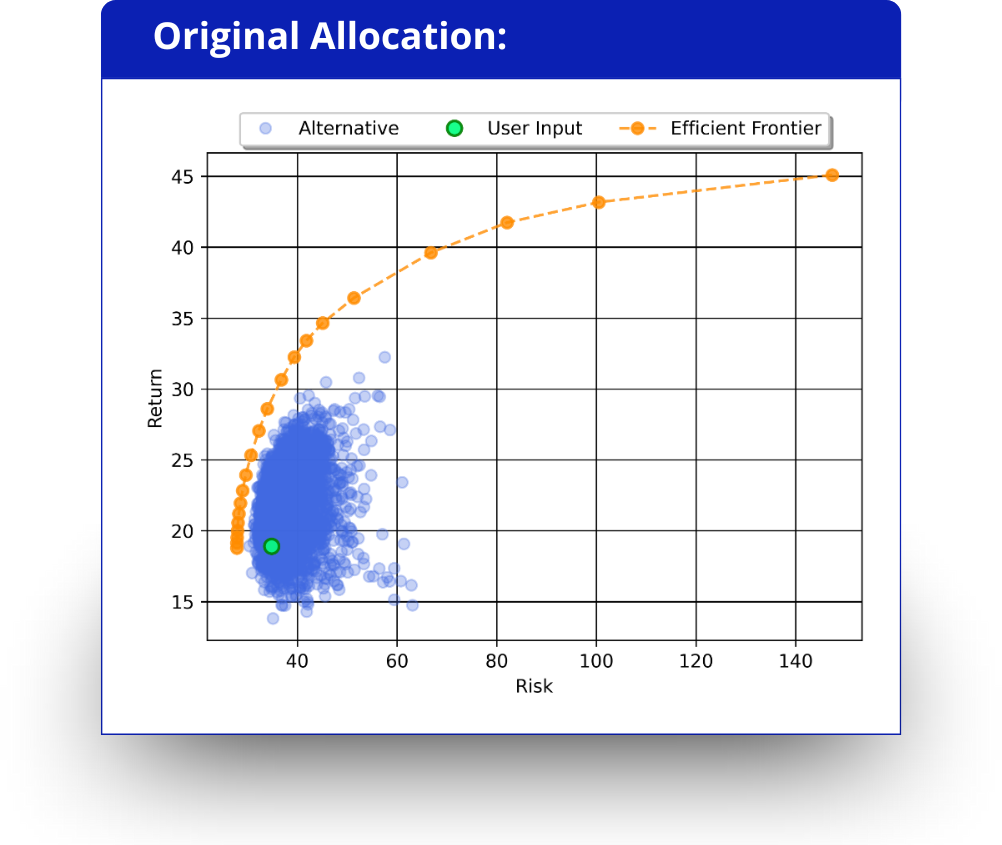
Robins saw on his ‘Portfolio Universe™’ diagram that there were several other portfolio positions that could offer a better expected return and a lower level of risk.
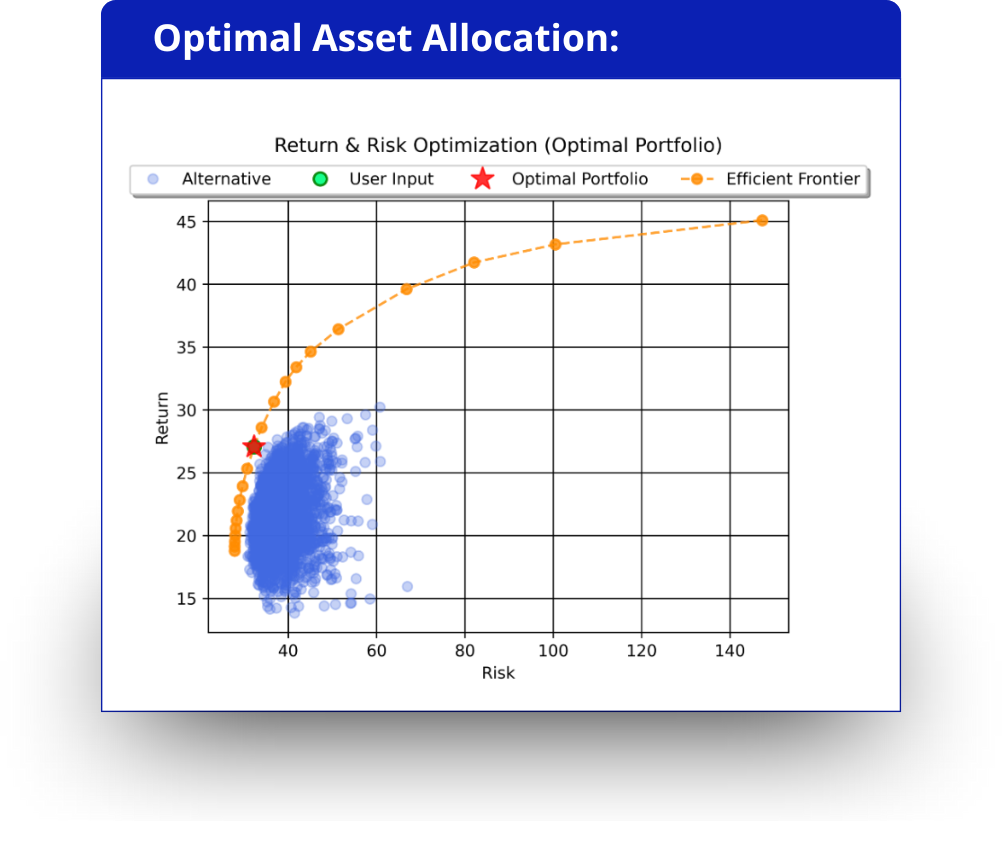
He decided to first optimise his portfolio using the ‘Calculate Optimal Portfolio’ feature. This gave him an allocation that maximised his portfolio expected return whilst minimising the risk.
Robins’ Optimal Portfolio allocation position can be seen below with an expected return of 27.05% and risk (volatility) of 32.24%:
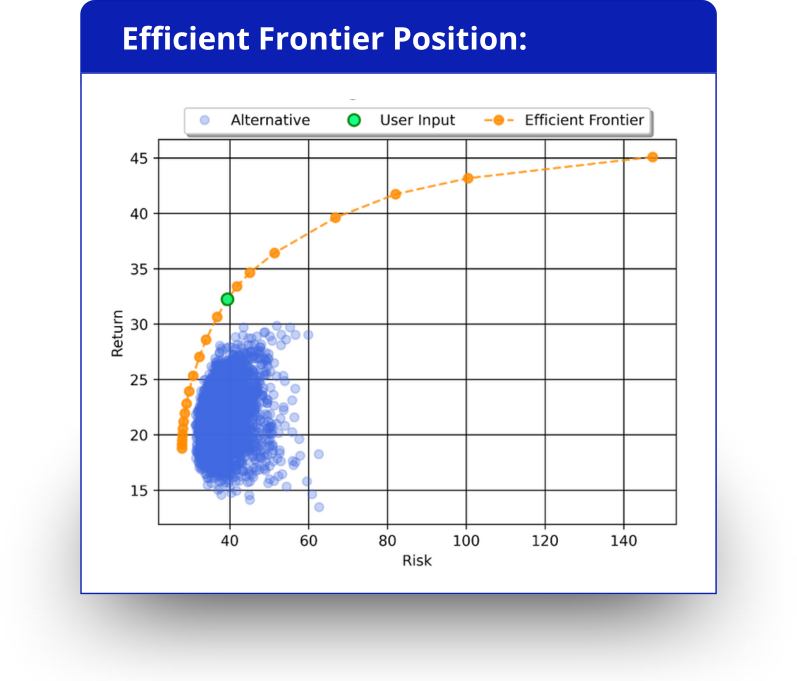
Although the Optimal Portfolio asset allocation increased Robins’ expectation of return, he was willing to accept a higher level of risk in exchange for potentially even greater expectation of returns. Using Diversiview’s ‘Efficient Frontier Positions’ feature, Robins went back and calculated an efficient asset allocation for a higher risk level.
The following graph shows his selected Efficient Frontier position with an expected return of 32.25% and risk (volatility) of 39.36%:
Reallocation Strategy
Based on the original analysis, the Optimal Portfolio expected results and the Efficient Frontier position expected results, Robins decided to go with the latter and reallocate his portfolio’s holdings to the Efficient Frontier position weights.
This strategic move aimed to maximise his expected return while maintaining a level of risk he was comfortable with.
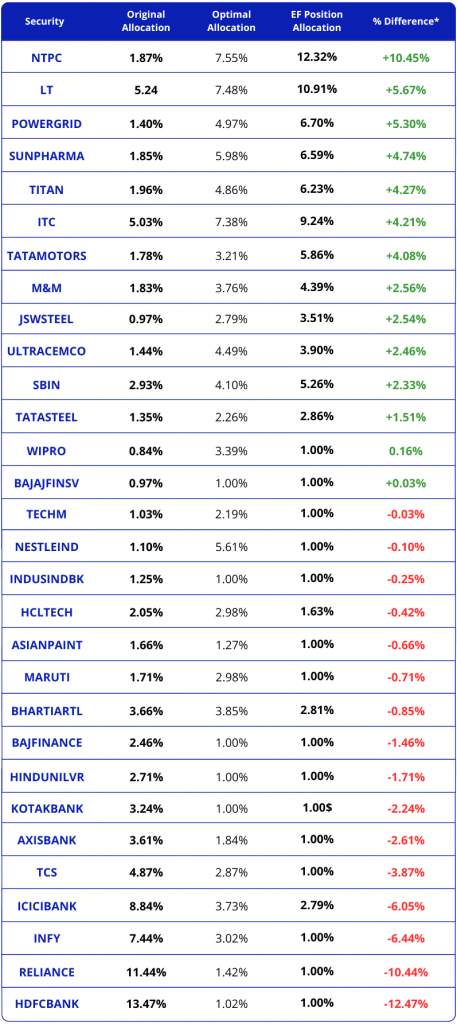
Key changes to asset allocation (for full changes click here):
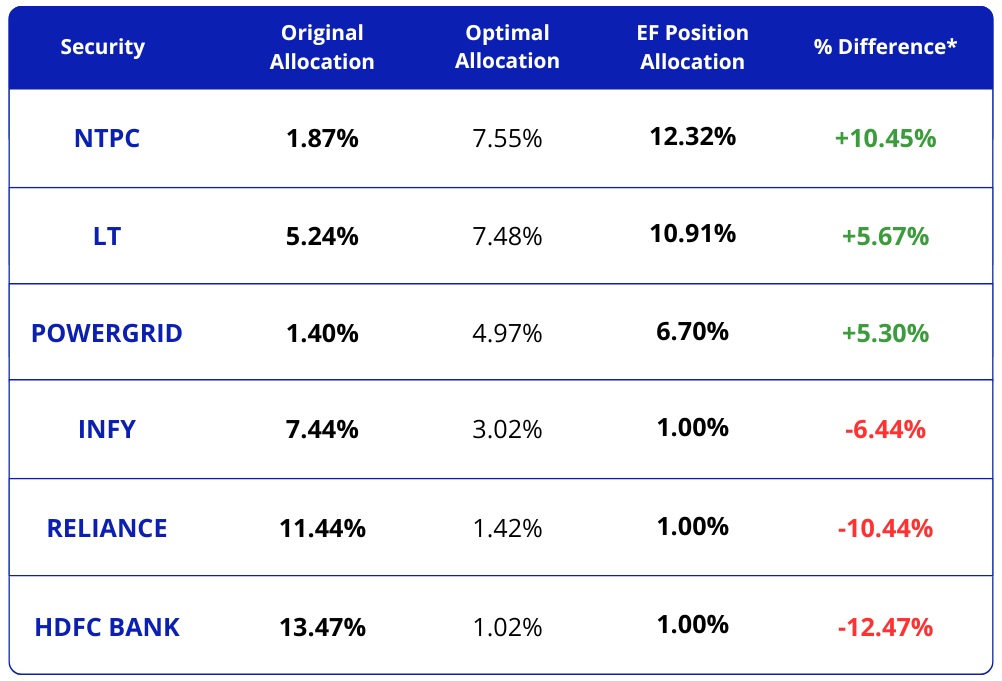
By implementing these changes, Robins was able to optimise his portfolio for improved performance within his desired risk tolerance.
Note: Diversiview does not provide financial advice or recommendations. Analyses are intended to provide investors with insights and information. The decision to reallocate assets was made solely by Robins.
Portfolio Performance
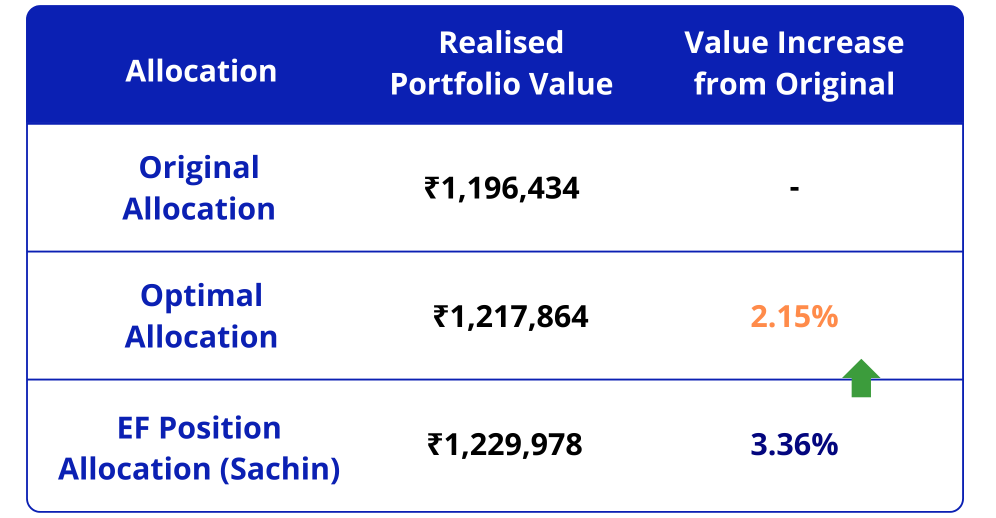
Robins’ investment strategy, informed by Diversiview’s Efficient Frontier calculations, yielded impressive results by September 25th, 2024, with his portfolio value surging to ₹1,229,978 from an initial value of ₹1,000,000. This represents a substantial increase of ₹229,978 (23.00%) in just over 8 months.
Allocation Comparison
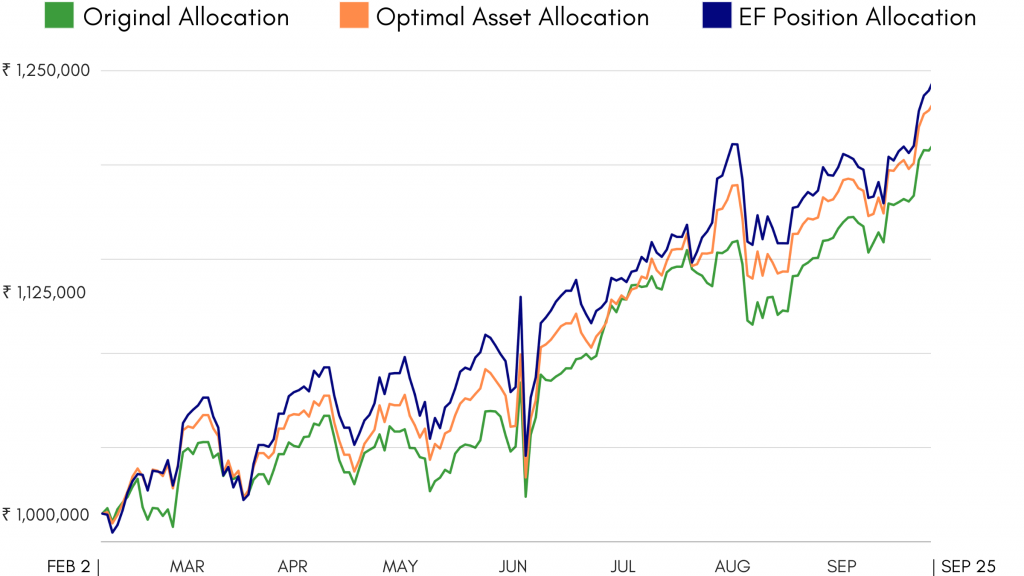
To assess the effectiveness of Diversiview’s Efficient Frontier position allocation, we compared Robins’ actual realised returns to two other scenarios:

As it can be seen from the portfolio value graph, the total portfolio value on 25th September 2024 with the Efficient Frontier Allocation was higher than the total portfolio value would have been in the Optimal Portfolio Allocation, and higher than the total portfolio value if the original allocation was maintained:
Conclusion
By leveraging Diversiview’s Efficient Frontier calculation, Robins was able to significantly enhance his portfolio’s performance. Within just over eight months, his portfolio value surged from ₹1,000,000 to ₹1,229,978, representing a remarkable 23.00% increase, and a 3.36% increase in value compared with a no change scenario (i.e. maintaining the original allocation).
Robins was not recommended a specific allocation. He was given options to consider, and made his own decision on the allocation going forward.
This case study demonstrates the power of data-driven investment strategies and the value of Diversiview’s portfolio optimisation tools.
Note: This analysis is based on the provided data and does not constitute financial advice. All data accurate as of September 2024. Investors should conduct their own research and consult with a financial advisor before making investment decisions.
Robins’ Holdings List with % Change From Original Allocation