Portfolio balancing has been a central theme in investing for decades. Developed in the 1950s by the late Harry Markowitz, his revolutionary concept of Modern Portfolio Theory (MPT) formalised the idea that diversification, or spreading your investments across different asset classes, is the key to managing risk and maximising potential returns.
One of the most powerful tools born from MPT is the Efficient Frontier. The efficient frontier is a graphical representation of all optimal portfolio combinations that offer the highest expected return for a given level of portfolio risk (volatility). Imagine a curved line on a graph; portfolios below the line are inefficient, offering lower returns for the same level of risk.

How Diversiview Utilises MPT and the Efficient Frontier
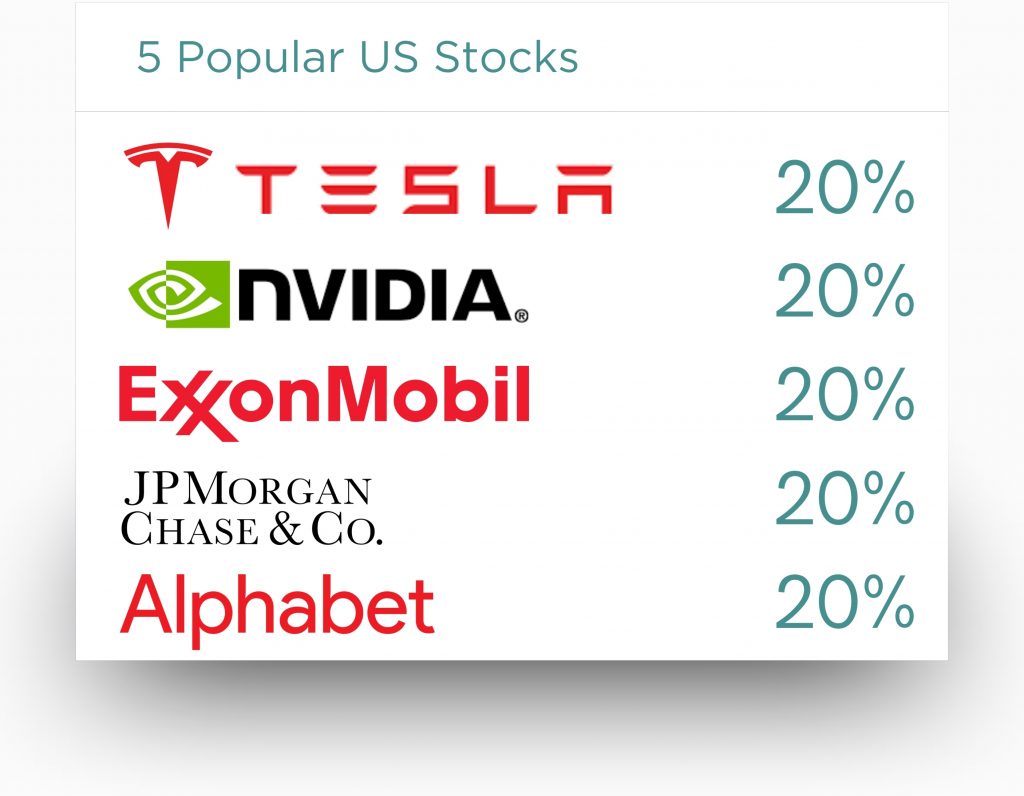
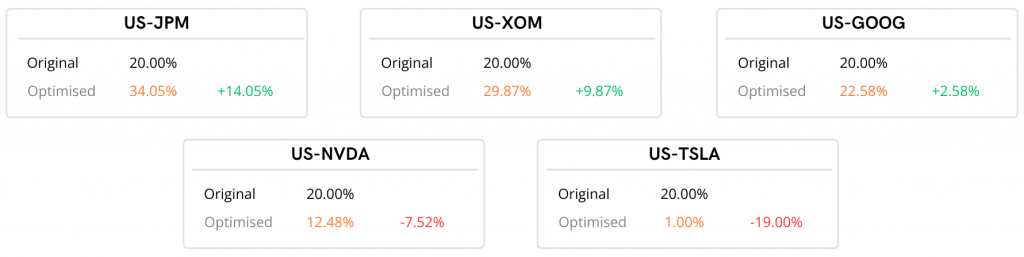
To illustrate how Diversiview utilises MFT and the efficient frontier, we have constructed a sample portfolio of 5 popular US stocks, with equal allocation:
We first analysed this portfolio with Diversiview, providing us with data-driven insights such as expected return, volatility, and other key performance metrics. These metrics paint a clear picture of the current portfolio’s risk-return profile. Knowing the starting point is crucial for identifying potential improvements.
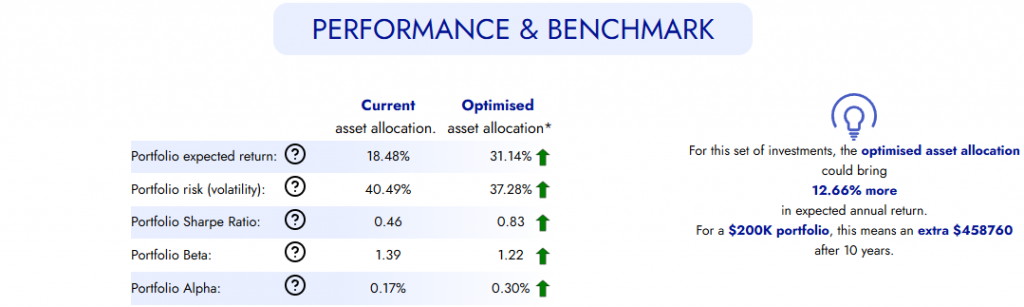
The “Performance & Benchmark” section highlights the inefficiency of the current portfolio, indicating that there is an optimal asset allocation that could potentially increase the expected annual return by 12.66%. For a $200,000 portfolio, this could be an increase of $458,760 in 10 years, compared to the original allocation.
Strategy Backtesting and Forecasting
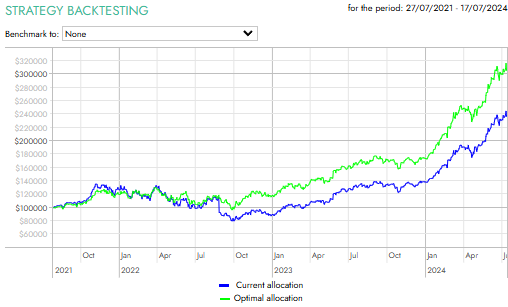
Diversiview also employs strategy backtesting, which involves analysing at least 3 years of historical performance data for each stock in your portfolio. Strategy backtesting ascertains the performance that an optimal allocation would have had in the same time period (using real past pricing data):
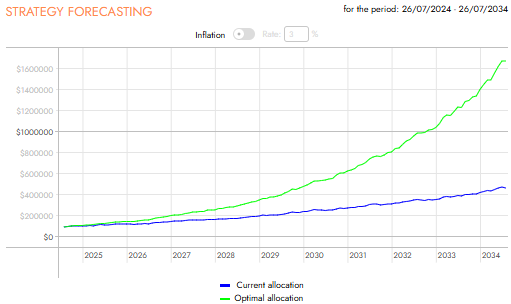
Diversiview forecasts the future portfolio value using this data and compares the optimal portfolio allocation with the original, on a monthly basis and compounded for 10 years (forecasted volatility is randomised within the historical volatility range):
Efficient Frontier Positions
Based on the backtesting results, Diversiview creates the portfolio’s efficient frontier in “Your Portfolio Universe®”. The Portfolio Universe® gives a visual representation of where your portfolio is positioned by mapping out thousands of other possible portfolio positions for the same set of holdings. The orange curve reveals the efficient portfolios where each point represents a portfolio with the highest expected return for a specific level of risk.
By comparing the current portfolio’s position to the Efficient Frontier, Diversiview gives us insight into the portfolio positions that could increase the expected return while maintaining similar risk, lower the portfolio’s volatility while achieving a similar expected return, or offer a combination of both – potentially higher expected returns with lower risk.
For this portfolio example, the optimal portfolio allocation could potentially increase the expected return and lower the portfolio’s risk:
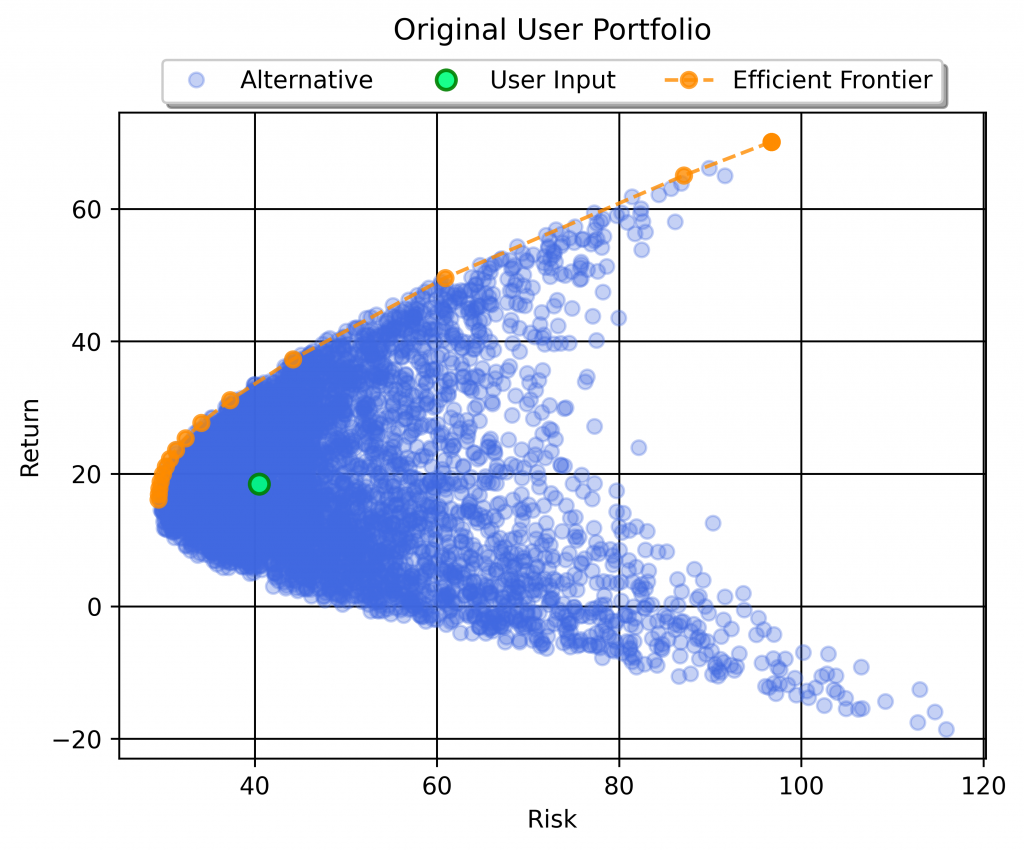
It is clear that an equal allocation for this portfolio is inefficient (i.e. the current portfolio position shown by the green point is under the Efficient Frontier). Using Diversiview’s optimisation features, we will be able to determine the asset allocations for any point on the efficient frontier. We can calculate the ‘Optimal Allocation’ which will increase our expected return to 31.14% and decrease our risk to 37.28%, or we can pick another point on the efficient frontier and calculate the asset allocation for that particular level of risk.
Diversiview Efficient Frontier Optimisation
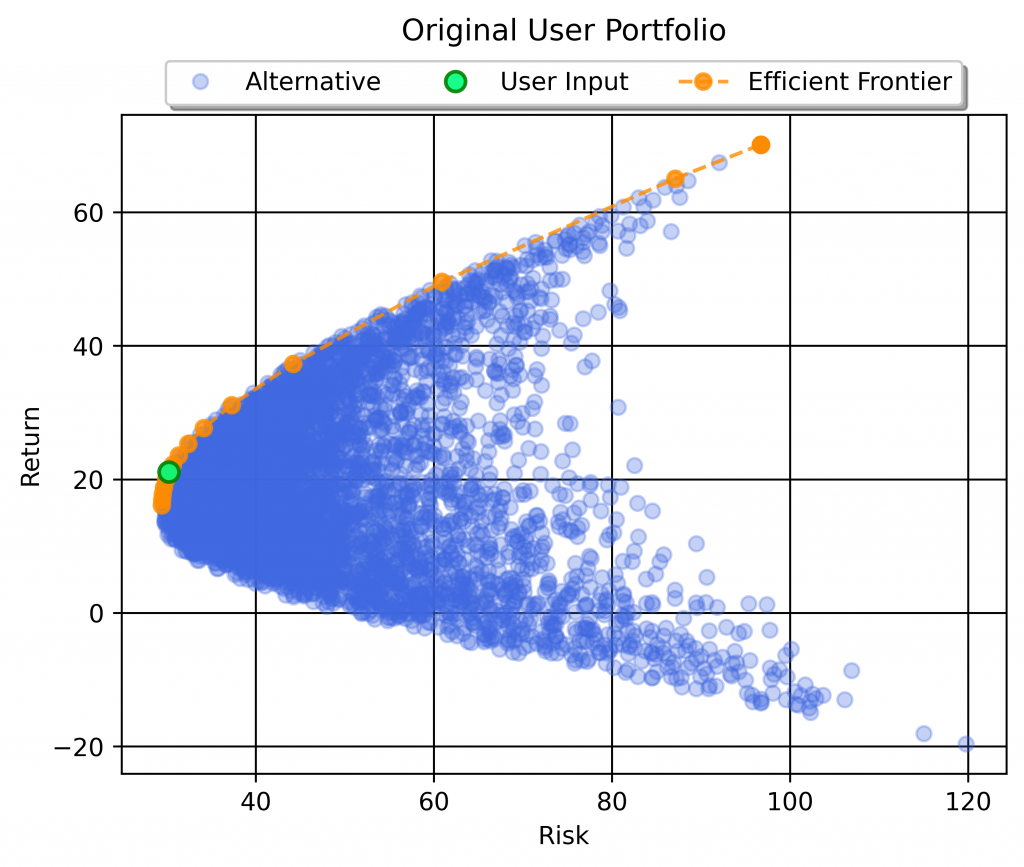
For this portfolio, 37.28% risk is still too high and we would prefer a portfolio with a lower risk, even if it also lowers expected portfolio return. We are more comfortable with a portfolio with a risk of 30.25% (and expected return of 21.10%) and would like to calculate the asset allocation for this risk level:
Diversiview will run a new analysis, calculating the asset allocation for this risk-return position:
And it shows where the new portfolio position sits on the efficient frontier:
By understanding and utilising the Efficient Frontier, investors can significantly enhance their portfolio performance. Diversiview’s advanced analytics and optimisation tools provides in-depth analysis, strategy backtesting, and more, empowering investors to make data-driven decisions. By identifying efficient frontier positions and understanding the potential impact on risk and return, investors can confidently manage their portfolio.
Remember, an efficient portfolio is not a static concept, as market conditions and investor goals evolve over time. Diversiview offers notifications and alerts for whenever your portfolio changes from the level of risk that you are comfortable with. Regular optimisation will help your portfolio to remain efficient.
Don’t leave your portfolio’s potential to chance! Get a free Diversiview analysis today and experience the power of data-driven investing.
Disclaimer: This portfolio scenario demonstrates the potential benefits of optimising your portfolio using efficient frontier calculations. Note that the results achieved are not guaranteed and may not apply to all portfolios. Regular optimisation is a valuable practice, however every portfolio is unique and the ideal frequency of optimisation will be different. Market conditions significantly impact performance. Diversiview helps you calculate efficient, optimised portfolio allocations that you can match to your specific risk tolerance and investment goals.