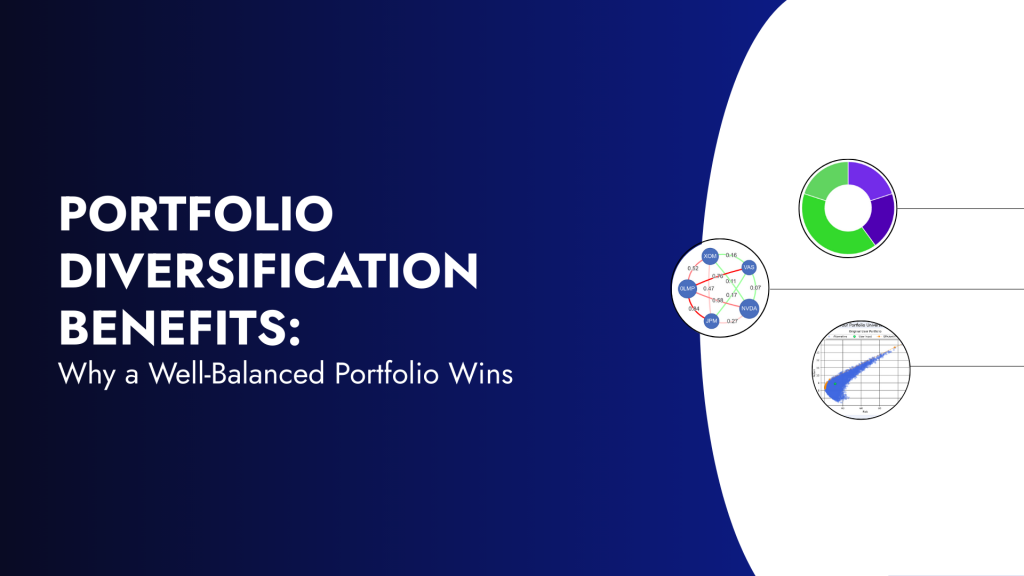
A well‑balanced portfolio seeks to improve the ratio of expected return to risk by combining assets that do not move in lockstep, cushioning drawdowns and allowing more consistent compounding as market leadership rotates. Diversiview provides correlations, risk‑contribution, and efficient‑frontier analytics that turn this concept into concrete, data‑driven insights, while remaining an information tool rather than a source of personal financial advice.
Why Portfolio Diversification Still Matters
Market leadership changes across sectors, regions, and styles; a theme that looks “obvious” can lag dramatically when conditions shift. Spreading exposures across independent drivers of return reduces the chance that a single disappointment derails long-term plans, and Diversiview helps diagnose where a portfolio may be overly top-heavy by sector or region.
When markets go down, stocks move together much more than they do when markets rise. In fact, during downturns, correlations are about 11% stronger than models would normally predict (1).
Importantly, diversification is not just about the number of holdings. Research shows that correlations between stocks tend to rise significantly during downturns; in other words, assets that seem independent in good times often move together when markets fall (1). This “asymmetric correlation” effect means that diversification may provide less protection during stress events than headline numbers suggest. Diversiview’s Granular Diversification view addresses this by making correlation patterns visible at the investment level, enabling evidence-based conversations about where overlap risk may be highest, even under adverse market conditions.
How Portfolio Diversification Works: Correlation In Practice
Modern Portfolio Theory shows that lowering the average pairwise correlation among holdings can reduce portfolio variance for a given expected return, improving the overall risk‑return trade‑off (2). Diversiview operationalises this with a Correlation Matrix and a Granular Diversification (network) Diagram that reveal clustering, strong positive ties, and areas where diversification could be improved.
Both visuals are complemented by “Your Portfolio Universe,” which plots thousands of potential risk‑return combinations for the same set of holdings and highlights where the current allocation sits versus efficient alternatives. This helps separate perception from data when assessing whether the allocation is working as intended.

Balanced allocations can dampen left‑tail outcomes and promote steadier compounding by improving correlation structure across independent drivers of return. Diversiview’s portfolio tool quantifies these dynamics so users can make informed, research‑backed decisions, supporting disciplined portfolio diversification and management in varied regimes without offering personal financial advice.
Poor vs. Strong Portfolio Diversification: Practical Contrasts
Concentrated factor basket: Holding many tickers within one growth or tech theme can feel diversified by count but often shares high positive correlations and synchronous drawdowns when regimes flip; Diversiview’s matrix and network views surface these clusters quickly.

Single‑market equity only: A domestic‑only core can become top‑heavy; sector and region breakdowns expose gaps, while Your Portfolio Universe shows whether the current point is sitting below the efficient curve.
Broad multi‑asset mix: Blending global stocks, ETFs, and selective diversifiers can shift the correlation profile; the efficient frontier shows the set of positions that offer the highest expected return for a given level of risk.
These contrasts are informational; they do not constitute recommendations. Diversiview provides calculations and visual diagnostics to aid independent research and adviser discussions.
Risk Reduction Without Return Surrender
The aim of portfolio diversification is not to accept lower returns but to improve risk‑adjusted returns so compounding is less frequently interrupted by deep drawdowns. In Diversiview, the efficient frontier highlights where portfolios can target higher expected return at the same risk, lower risk at a similar return, or a combination, framed as scenario calculations for consideration.
Diversiview also presents risk‑contribution analytics that show which holdings dominate total volatility. A “balanced” weight mix can still produce lopsided risk if one sleeve’s volatility or correlation is higher; seeing this quantitatively helps refine allocations with discipline.
Practical Scenarios to Explore
- Overweight growth equities: The matrix and network may show a cluster of strong positive correlations across holdings; introducing differentiated exposures can change the correlation structure, potentially moving the current point closer to the frontier at a given risk. The efficient‑frontier calculator makes these shifts visible for evaluation.
- Home‑country bias: Sector and region diagnostics can reveal gaps in the opportunity set; Your Portfolio Universe highlights whether a different mix across the same holdings could increase expected return or reduce risk.
- Single bond allocation: Concentration in long‑duration government bonds can heighten rate sensitivity; a multi‑sleeve fixed‑income mix may alter correlations to equities and stabilise behaviour across cycles, as illustrated on the frontier. These are informational analyses, not directives.
Case‑study‑style resources on Diversiview’s blog show how efficient frontier positioning, backtesting, and forecasting can be examined for sample portfolios. The articles demonstrate the mechanics and interpretive steps while including clear disclaimers that results are not guaranteed and may not apply to all portfolios.
Building a Diversified Core in 2025
- Global equity core: Diversify across regions, market caps, and sectors to reduce top‑heaviness; check how the breadth affects frontier shape and the current position.
- Layered fixed income: Blend duration and credit quality to manage rate and credit cycles; review how correlations to equities evolve and how frontier options shift.
- Selective diversifiers: Listed real estate or commodities can alter correlation patterns; verify via correlation and risk‑contribution views before deciding on fit.
- Implementation hygiene: Use the analysis and screening resources to assess whether candidate additions complement the existing mix; confirm fit in Your Portfolio Universe prior to any changes.
Common Pitfalls to Avoid
- Ticker‑count diversification: Many holdings in one factor can still be highly correlated; validate with the matrix and network views (4).
- Static correlation assumptions: Correlations and the frontier evolve with regimes; periodic analysis helps maintain alignment with the preferred risk profile (4).
- Neglecting rebalancing discipline: Drift can increase concentration and drawdown risk; recalculating frontier positions can inform a review cadence without dictating specific transactions (3).
How Diversiview Helps
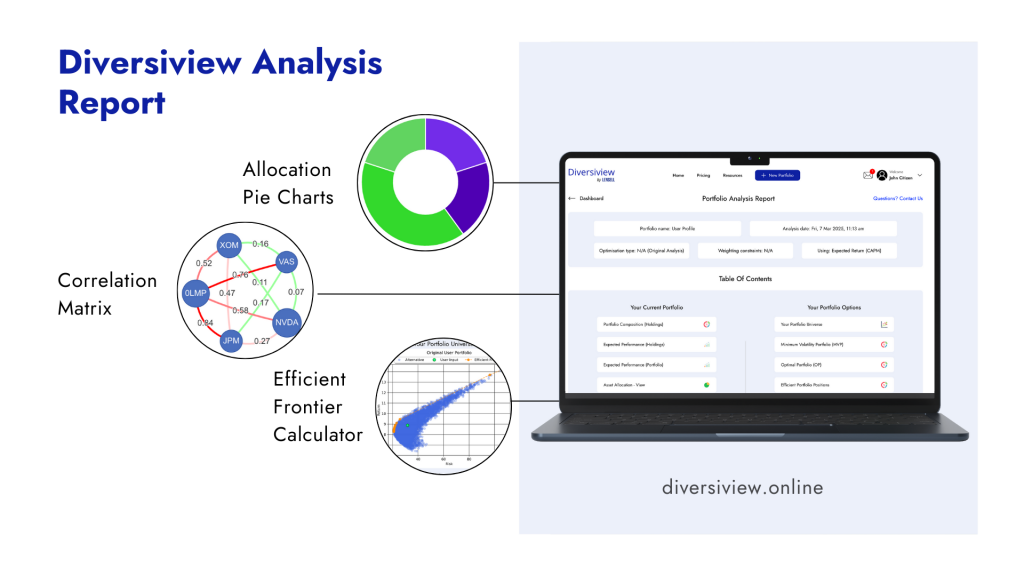
- Allocation Pie Charts (asset/sector): Quickly reveal concentration patterns that may be hidden in a long holdings list.
- Correlation Matrix and Granular Diversification Diagram: Expose overlap risks and clustering across holdings.
- Efficient frontier in Your Portfolio Universe: Calculate key portfolio metrics for the current allocation versus efficient frontier positions to understand potential trade‑offs.
Each visual is designed to inform analysis; not to constitute advice or a recommendation to transact.
A Six‑step Diversiview Workflow
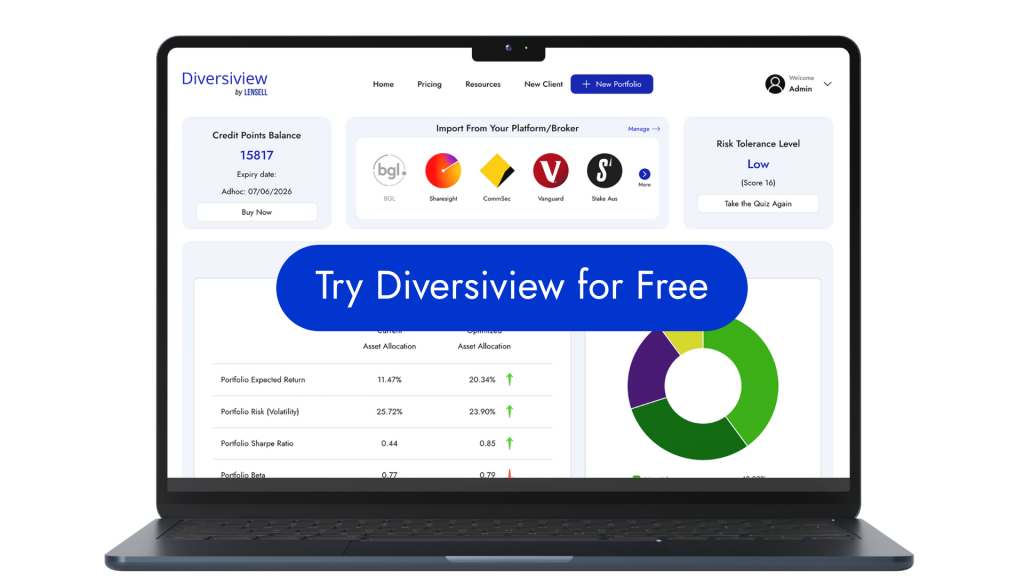
- Upload holdings by linking a broker account, uploading a CSV, or entering investments manually. These inputs create the foundation for the analysis report.
- Review allocation pie charts, expected historical return, and Your Portfolio Universe to see where the current configuration sits relative to an optimal portfolio allocation.
- Open the Correlation Matrix and Granular Diversification diagram to identify strong positive clusters and overlap risks; filter correlations to focus on the largest drivers.
- Examine industry, segment and asset concentration to quantify home‑bias and theme risk, using the report’s breakdowns as a diagnostic.
- Run the allocation calculation for Minimum Risk, Optimal, or the chosen efficient‑frontier position; the platform returns target weights and updates the position on the curve.
- Compare before/after expected metrics and risk contributions; consider independent research or licensed advice before rebalancing to align with the evaluated target mix.
Turning Insights Into Action, Carefully and Transparently
Diversiview’s workflow converts theory into data‑driven analysis without dictating what to buy or sell. After uploading holdings, the system calculates expected return, risk, Sharpe, alpha, beta, correlations, and maximum draw down, then plots the portfolio among thousands of other possible positions based on the same holdings.
Users can then calculate Minimum Risk, Optimal, efficient frontier allocations, or with user expected returns at a selected volatility level. The platform calculates the target weights for the chosen point so the risk‑return implications can be evaluated in context. These outputs are scenario calculations, not personal recommendations, and should be weighed alongside independent research or licensed professional guidance.
Take control of your financial future! Open a free Diversiview account and get one FREE Portfolio Analysis, and discover how smart, data-driven decisions can help you achieve your goals.

Note: Diversiview does not provide financial advice or recommendations. Investment Portfolio Analyses are intended to provide investors with data driven insights and information. You should do your own further research, or speak with a licensed professional before making changes to your investment portfolio.
- Asymmetric correlations of equity portfolios
- Markowitz, H. (1952). Portfolio Selection. The Journal of Finance, 7(1), 77–91.
- The right way to rebalance your investment portfolio
- Why more diversification doesn’t mean better returns