View the top 25 US-listed ETFs sorted by lowest Maximum Drawdown*. Indicators are valid as at 16 October 2025.
*For the purpose of this ranking, Maximum Drawdown (MDD) measures the maximum fall in the value of the investment, as given by the difference between the value of the lowest trough and that of the highest peak before the trough. The MDD Recovery Time (MDD-RT) measures how many calendar days after the lowest trough the investment took to climb back up to the value of the previous highest peak.
NOTE: Only ETFs with 3 years history and having expected return (historical) greater than the expected volatility have been included in this list.
| Ticker | Name | CAGR (3yr) | Volatility | MDD | MDD-RT (days) |
| YLDE | Legg Mason ETF Investment Trust-ClearBridge Dividend Strateg | 14.88% | 12.56% | 0 | n/a |
| YALL | Tidal ETF Trust-God Bless America ETF | 30.57% | 18.03% | 0 | n/a |
| XLSR | SSgA Active Trust-SPDR SSGA U.S. Sector Rotation ETF | 17.40% | 16.47% | 0 | n/a |
| XCEM | Columbia ETF Trust II-Columbia EM Core ex-China ETF | 16.26% | 15.44% | 0 | n/a |
| XAR | SPDR Series Trust-SPDR S&P Aerospace & Defense ETF | 34.15% | 20.33% | 0 | n/a |
| WWJD | Northern Lights Fund Trust IV-Inspire International ETF | 16.27% | 15.35% | 0 | n/a |
| VXUS | Vanguard Group Inc.-Vanguard Total International Stock ETF | 17.15% | 14.78% | 0 | n/a |
| VV | Vanguard Group Inc.-Vanguard Large Cap ETF | 22.35% | 16.29% | 0 | n/a |
| VUSE | ETF Series Solutions Trust-Vident U.S. Equity Strategy ETF | 18.99% | 15.64% | 0 | n/a |
| VTI | Vanguard Group Inc.-Vanguard Total Stock Market ETF | 21.20% | 16.44% | 0 | n/a |
| VTHR | Vanguard Group Inc.-Vanguard Russell 3000 Index ETF | 21.18% | 16.31% | 0 | n/a |
| VT | Vanguard Group Inc.-Vanguard Total World Stock ETF | 19.74% | 14.88% | 0 | n/a |
| VSLU | ETF Opportunities Trust-Applied Finance Valuation Large Cap | 23.95% | 15.57% | 0 | n/a |
| VOT | Vanguard Group Inc.-Vanguard Mid-Cap Growth ETF | 19.38% | 18.94% | 0 | n/a |
| VOOV | Vanguard Group Inc.-Vanguard S&P 500 Value ETF | 15.39% | 13.94% | 0 | n/a |
| WRND | IndexIQ ETF Trust-IQ Global Equity R&D Leaders ETF | 24.85% | 17.59% | 4.02% | 11 |
| XNTK | SPDR Series Trust-SPDR NYSE Technology ETF | 43.10% | 25.83% | 6.39% | 7 |
| WLTG | ETF Opportunities Trust-WealthTrust DBS Long Term Growth ETF | 21.09% | 14.00% | 7.53% | 94 |
| VOOG | Vanguard Group Inc.-Vanguard S&P 500 Growth ETF | 27.18% | 19.74% | 8.07% | 8 |
| XLK | SSgA Active Trust-Technology Select Sector SPDR ETF | 33.04% | 24.08% | 8.30% | 7 |
| VOX | Vanguard Group Inc.-Vanguard Communication Services ETF | 29.29% | 19.91% | 10.72% | 28 |
| VUG | Vanguard Group Inc.-Vanguard Growth ETF | 30.41% | 20.80% | 10.85% | 30 |
| WINN | Harbor ETF Trust-Harbor Long-Term Growers ETF | 30.61% | 21.45% | 11.09% | 30 |
| XNAV | Fundx Investment Trust-FundX Aggressive ETF | 19.23% | 18.51% | 11.76% | 87 |
| XCOR | Fundx Investment Trust-FundX ETF | 18.82% | 17.57% | 12.99% | 122 |
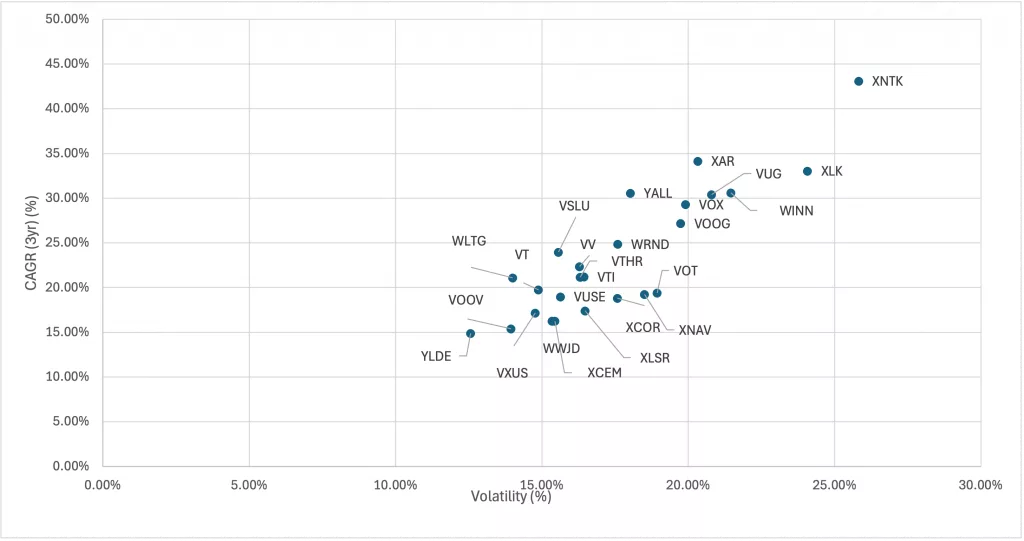
Figure 1 below shows the 25 US ETFs listed above plotted by their CAGR and volatility. You can explore these and other securities in Diversiview, and see a number of past and expected performance indicators including expected return based on historical data and expected return based on the CAPM model.
A view of the top 25 US-listed ETFs with lowest MDD
Diversiview supports your investment research – explore any security in Diversiview, from any of the markets we cover, and see their expected and past performance indicators. You can do that for free, by going to top menu –> Resources –> Explore securities.
NEXT STEP?
Once you identified your preferred investments, you can see how those investments work together, by themselves or with other investments in your portfolio. Diversiview can help with a comprehensive analysis – login to your account, or sign up for a free account today.
Disclaimer:
LENSELL GROUP Pty Ltd, ACN 646 467 941, trading as LENSELL, is a Corporate Authorised Representative of Foresight Analytics & Ratings Pty Ltd ( Australian Financial Services Licence No. 494552). All information provided to you by LENSELL is intended for general informational purposes only. It does not consider your individual financial circumstances and should not be relied upon without consulting a licensed investment professional or adviser.
The content on this website and in any of its applications is not a financial offer, recommendation, or advice to engage in any transaction. Investment products referenced in our software or marketing literature carry inherent risks, and you should note that past performance does not guarantee any future results. In all our modelling, no transaction costs or management fees are factored into performance analysis.
The information on our website or our mobile application is not intended to be an inducement, offer or solicitation to anyone in any jurisdiction in which LENSELL is not regulated or able to market its services.
Furthermore, all information used across our platform or website may be based on sources deemed reliable but is provided “as is” without guarantees of accuracy or updates. LENSELL and Foresight Analytics & Ratings disclaim all warranties and accepts no liability for any loss or damage resulting from use or reliance on any material or data embedded in our technology platform or digital media. Where liability cannot be excluded by law, it is limited to resupplying the information.
Please view our Financial Services Guide, Terms Of Service and Privacy Policy before making any investment decision using the information available on our website or on any of our applications. LENSELL, Diversiview and TableBits are trademarks registered in Australia.