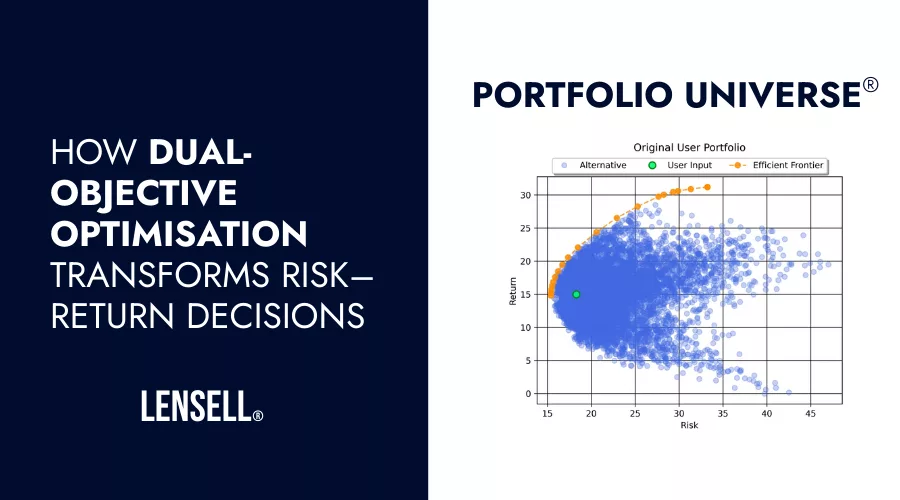
Most portfolio optimisation conversations start with equations, constraints, or asset views. But when investors look at their Diversiview portfolio analysis report, the first thing they see is not a formula, it’s a map of their Portfolio Universe.
A clear, intuitive risk–return Portfolio Universe® diagram that shows:
- Where their current portfolio sits today.
- Which other portfolio positions are mathematically possible.
- Where the Efficient Frontier lies.
- How far efficiency can improve, either by lowering risk, increasing return, or both.
The visual starting point matters, because making good portfolio decisions requires seeing the full landscape of possibilities.
This is exactly where the Dual-Objective Optimisation Approach (DOOA) changes the game for investors and professionals who want to understand and improve their portfolio’s positioning.
The Limitation of Traditional MVO: It Forces You to Choose
Mean–Variance Optimisation (MVO) has long been the standard quantitative approach in portfolio construction. It produces the familiar Efficient Frontier — a curve of portfolios that maximise expected return for each level of risk. But MVO has a major drawback:
It forces you to choose one objective at a time
You can either:
Maximise return for a given level of risk, OR
Minimise risk for a target return
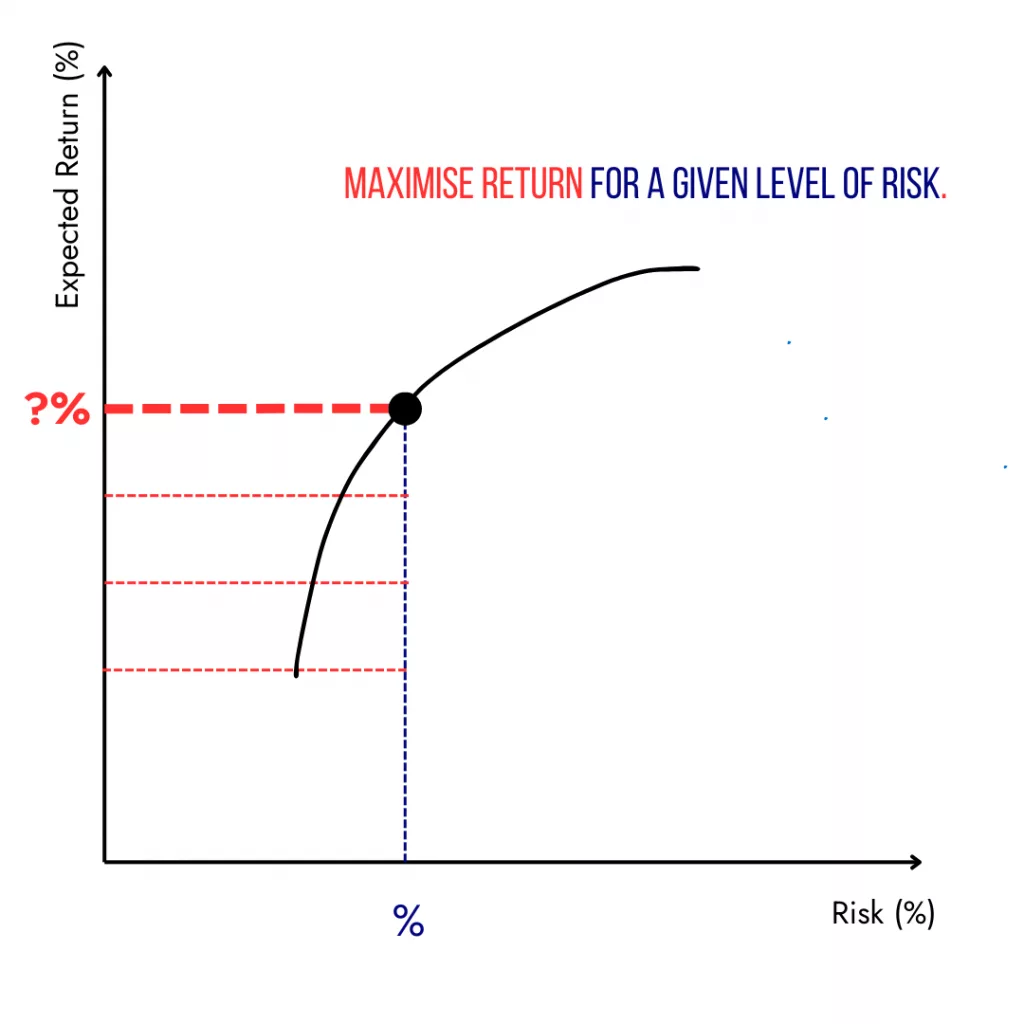
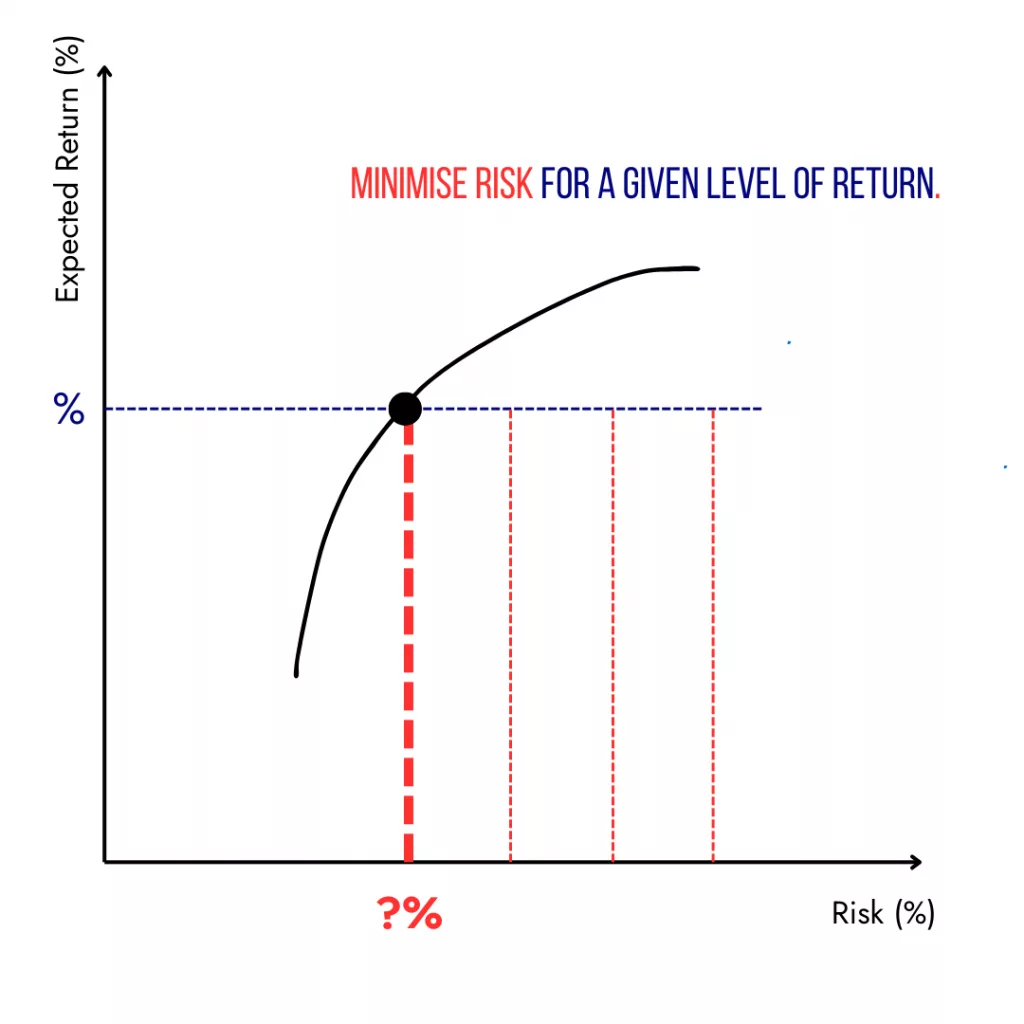
The major drawback of this approach is that investors lack context, causing them to introduce their own bias/es when selecting the target return or target risk. They do not know if the target is the best it could be, because they don’t know what else is available.
Therefore, investors will need to run numerous scenarios and calculations to identify the portfolio position that a) lies on the Efficient Frontier and b) represents the optimal outcome among the scenarios tested.
Diversiview’s Risk–Return Universe Reveals What MVO Hides
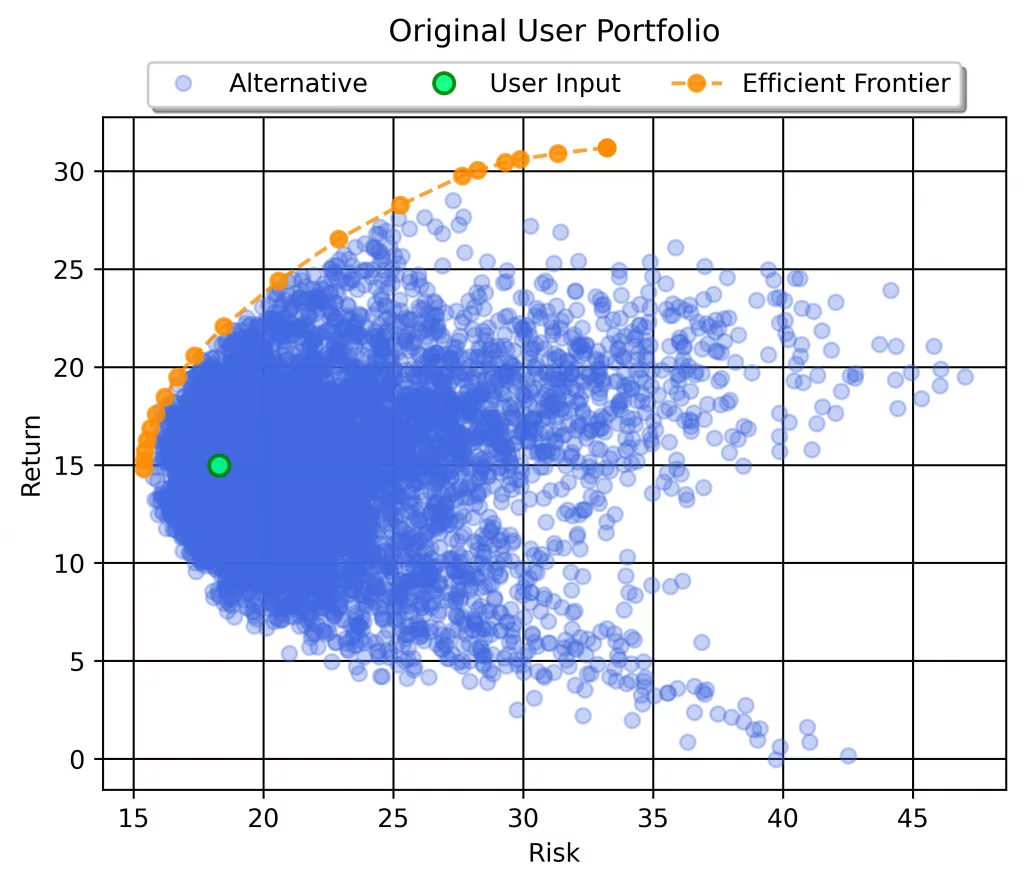
When you analyse a portfolio in Diversiview, the system instantly visualises:
1. The expected portfolio performance in its current allocation
Plotted as a point on the risk–return Portfolio Universe® diagram (the green point) — your portfolio’s expected annualised risk and return.
2. A wide spectrum of mathematically possible portfolios
This shows the underlying “universe” of other risk–return combinations achievable with your asset list and constraints (the blue points).
3. The Efficient Frontier
A curved boundary (the orange points) showing the most efficient portfolio positions that could be calculated for your set of investments.
4. The gaps between “where you are” and “what’s possible”
This is where optimisation becomes real. The chart makes it immediately obvious whether your current portfolio:
- takes more risk than it needs to,
- leaves return on the table, or
- sits far below the efficient region.
This visual gives users something that MVO alone never provides: context.
Most Investors Want to Move Either Left, Up, or Both
Once investors see their risk–return map, their objectives become intuitive:
- Move left → reduce risk without sacrificing return
- Move up → boost expected return for the same risk
- Move up and left → find a “sweet spot” of both improvements
Diversiview’s DOOA is designed precisely to help achieve this.
Rather than relying on guesswork or manually selecting a point on the Efficient Frontier, DOOA mathematically determines the single best position you can move toward.
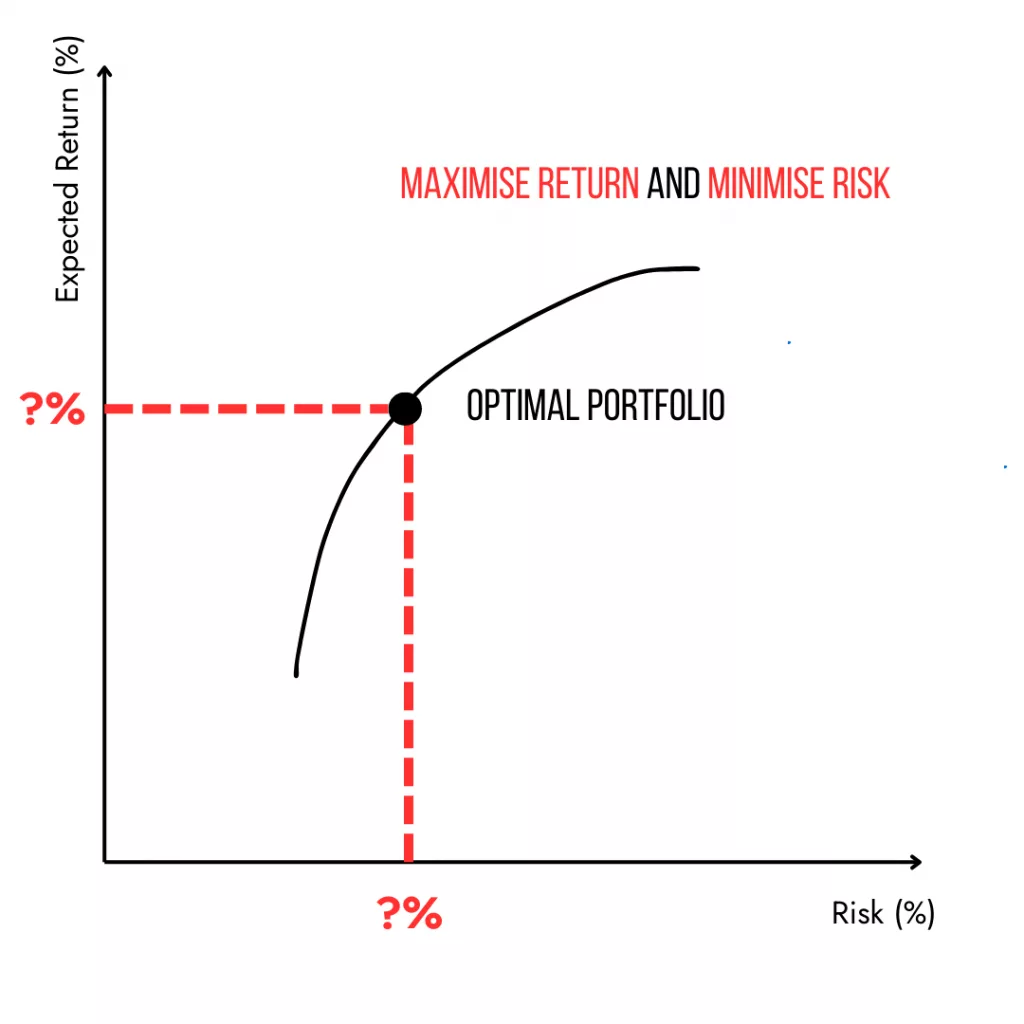
Dual-Objective Optimisation (DOOA): Optimising Risk AND Return, Not Choosing Between Them
Traditional MVO forces a choice: optimise return or minimise risk. DOOA optimises both objectives simultaneously in one unified mathematical problem. This produces a single, unique portfolio: The Optimal Position (OP).
The OP is the point in the risk–return universe where your portfolio reaches maximum efficiency: the best possible combination of high expected return and low expected risk, given:
- your assets,
- your constraints,
- your correlations, and
- your expected return inputs.
It represents the location investors intuitively want to reach: up and/or left on the chart.
DOOA Works With Any Return Forecast Methodology
Your expected returns are inputs, and DOOA is agnostic to how you generate them.
The DOOA solver works exactly the same, no matter if you use:
- Black–Litterman views
- CAPM
- factor-based forecasts
- historical averages
- CIO forward-looking assumptions
- third-party research
- or your own subjective estimates
This respects the natural separation between return modelling (investment philosophy and judgment) and optimisation (pure mathematics identifying the dominant portfolio). This independence is essential for governance, auditability, and professional practice.
Why This Approach is More Practical than Classical MVO Alone
1. You get a visual understanding before optimisation happens
Most tools optimise first, explain later. Diversiview shows you the landscape, then helps you move within it.
2. You get a clear answer, not a curve
The OP eliminates the bias of choosing a point on the frontier.
3. Stability improves
Dual-objective optimisation produces more stable weights than have been proven in practice.
4. More natural alignment with client conversations
Investors intuitively understand:
- “move left” (less risk)
- “move up” (more return)
- “move up and left” (better efficiency)
DOOA turns these intuitive ideas into mathematically robust results.
5. Perfect for model portfolios, SMA/IMA management, and advice workflows
It enables consistent, repeatable, explainable optimisation, all supported by visual analytics.
In Conclusion: DOOA + Portfolio Universe Helps Investors Make Better Portfolio Decisions
Diversiview combines a modern optimisation engine with a clear, intuitive visualisation of your entire portfolio universe.
You see:
- where you are now,
- what’s possible,
- how the efficient frontier behaves, and
- where diversification improvements really lie.
Then DOOA goes further, mathematically identifying the single optimal portfolio that maximises return and minimises risk at the same time.
This brings Modern Portfolio Theory into a modern interface, helping investors not just understand the frontier, but move toward the most efficient point on it.
Want to see DOOA in practice? Analyse and Optimise your Portfolio today with a free Diversiview account.
Disclaimer:
LENSELL GROUP Pty Ltd, ACN 646 467 941, trading as LENSELL, is a Corporate Authorised Representative of Foresight Analytics & Ratings Pty Ltd ( Australian Financial Services Licence No. 494552). All information provided to you by LENSELL is intended for general informational purposes only. It does not consider your individual financial circumstances and should not be relied upon without consulting a licensed investment professional or adviser.
The content on this website and in any of its applications is not a financial offer, recommendation, or advice to engage in any transaction. Investment products referenced in our software or marketing literature carry inherent risks, and you should note that past performance does not guarantee any future results. In all our modelling, no transaction costs or management fees are factored into performance analysis.
The information on our website or our mobile application is not intended to be an inducement, offer or solicitation to anyone in any jurisdiction in which LENSELL is not regulated or able to market its services.
Furthermore, all information used across our platform or website may be based on sources deemed reliable but is provided “as is” without guarantees of accuracy or updates. LENSELL and Foresight Analytics & Ratings disclaim all warranties and accepts no liability for any loss or damage resulting from use or reliance on any material or data embedded in our technology platform or digital media. Where liability cannot be excluded by law, it is limited to resupplying the information.
Please view our Financial Services Guide, Terms Of Service and Privacy Policy before making any investment decision using the information available on our website or on any of our applications. LENSELL, Diversiview and TableBits are trademarks registered in Australia.