
What are Efficient Frontier Positions?
The Model Portfolio Theory introduced by Harry Markowitz in 1952 says that any set of investments can be combined in a multitude of ways, where each combination have a unique risk-return profile determined by the asset allocation. That is, each asset allocation will determine a specific portfolio position because the asset allocation is the shared variable between portfolio risk and portfolio return.
Markowitz also showed that, due to the mathematical formula for portfolio risk and portfolio return, plotting the multitude of portfolio positions would give a shape as the one in Figure 1 below. In Diversiview, we call that the “Portfolio Universe”, meaning the totality of portfolio positions for a given set of investments. In Figure 1 they are shown as the blue points on the diagram.

Efficient Frontier positions are those portfolio positions in the Portfolio Universe that have the highest possible expected return for a specific level of risk. In Figure 1 above they are shown as the set of orange points as the top border of the diagram.
There are multiple efficient positions, for different levels of risk, and Diversiview is the single tool that allows you to select the risk-return position on the Efficient Frontier that works best for you, and calculate the asset allocation that corresponds to that particular risk-return position.
How to do that: In Diversiview, select the “Calculate Efficient Frontier Positions” option, and on the popup provided drag the risk (volatility) selector to the desired level. You will see the expected portfolio return for that level of risk displayed directly under the risk/volatility selector. See an example below:
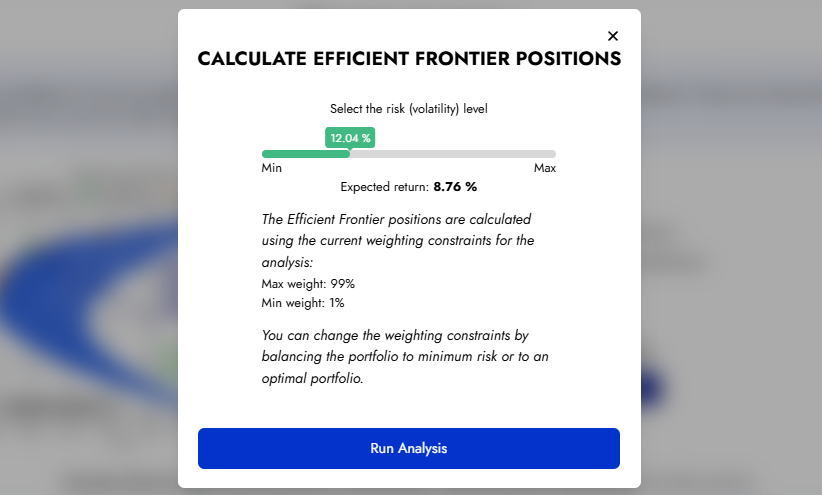
For a step by step guide on how to calculate efficient frontier positions, click here.
What is the Optimal Portfolio Allocation?
Optimal Portfolio is a unique point on the Efficient Frontier that provides the maximum expected portfolio return and the minimum expected portfolio risk at the same time.
In Diversiview, the Optimal Portfolio Position is indicated by a red star on the Efficient Frontier. See an example in Figure 2 below:

Many people would know about the celebrated 60/40 optimal position – that rough split may not always be the correct result for any portfolio, and the actual weights are often more granular and depending on the actual portfolio holdings (their expected returns, volatility an correlations). In Diversiview we show that an Optimal Portfolio position can be calculated very easily and fast with the help of technology, for any portfolio.
For a step by step guide on how to calculate the Optimal Portfolio allocation in Diversiview, click here.
Potential Performance Difference between EF Positions and Optimal Portfolio
Optimising an asset allocation for the Optimal Portfolio position will give different results compared with optimising for any other position on the Efficient Frontier. That is because other positions will have higher expected return at higher risk, or lower expected return at lower risk. Only the Optimal Portfolio position gives both highest expected return and the lowest portfolio risk at the same time.
In practice, people can use Diversiview to optimise their asset allocation for any risk-return position on the Efficient Frontier that suits them best. It is possible that a position located higher on the Efficient Frontier compared with the Optimal Portfolio will give a higher realised return (see EF position allocation in Figure 4 below), however the risk taken in achieving those returns is also higher.
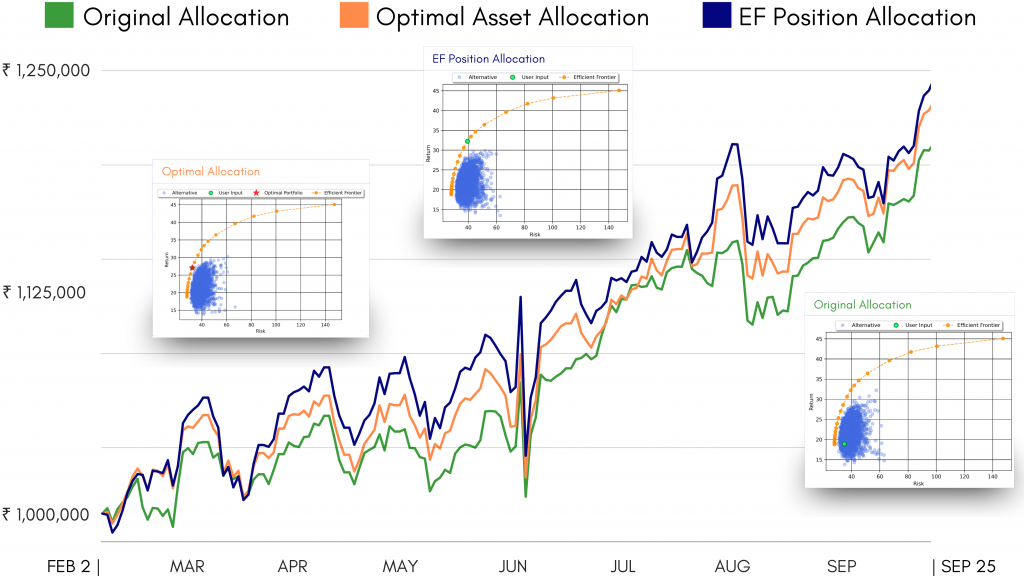
| Portfolio Expected Return | Portfolio Risk (Volatility) | Realised Gains | |
| Original Portfolio | 18.90% | 34.80% | 19.64% |
| Optimal Portfolio | 27.05% | 32.24% | 21.79% |
| Efficient Frontier | 32.25% | 39.36% | 23.00% |
Note: Diversiview does not provide financial advice or recommendations. Analyses are intended to provide investors with insights and information. This is a real portfolio and the decision to reallocate assets was made solely by the user.
Ready to calculate Efficient Frontier positions or the Optimal Portfolio allocation of your portfolio? Log in or sign up to your Diversiview account today to start analysing and optimising your investments.