View the top 20 LSE-listed ETFs sorted by highest CAGR (Compound Annual Growth Rate). NOTE: To allow for fair comparison, only ETFs with 3 years history have been included in this list.
Indicators are valid as at 23 October 2025.
| Ticker | Name | CAGR (3yr) | Variability of returns |
| 0XBH | Multi Units France – Lyxor Ibex 35 Doble Apalacando Diario UCITS ETF | 63.66% | 29.75% |
| DAPP | VanEck UCITS ETFs plc- VanEck Crypto And Blockchain Innovators UCITS ETF | 62.71% | 77.75% |
| SEMU | Multi Units Luxembourg – Amundi MSCI Semiconductors ESG Screened UCITS ETF | 60.95% | 32.31% |
| BKCH | Global X ETFS ICAV – Global X Blockchain Ucits ETF | 59.68% | 73.47% |
| AUCO | Legal & General UCITS ETF Plc – L&G Gold Mining UCITS ETF | 57.45% | 35.09% |
| 0WA4 | Multi Units France – Amundi FTSE MIB Daily (2x) Leveraged UCITS ETF | 57.07% | 31.99% |
| DAGB | VanEck UCITS ETFs plc- VanEck Crypto And Blockchain Innovators UCITS ETF | 53.49% | 71.67% |
| SEMG | Multi Units Luxembourg – Amundi MSCI Semiconductors ESG Screened UCITS ETF | 51.75% | 30.50% |
| BKCG | Global X ETFS ICAV – Global X Blockchain Ucits ETF | 50.62% | 72.39% |
| BNKE | Multi Units Luxembourg – Amundi EURO STOXX Banks (DR) UCITS ETF | 50.36% | 21.99% |
| S7XP | Invesco Markets plc – Invesco EURO STOXX Optimised Banks UCITS ETF | 49.18% | 22.07% |
| GDXJ | VanEck UCITS ETFs plc – VanEck Junior Gold Miners UCITS ETF | 48.40% | 35.41% |
| AUCP | Legal & General UCITS ETF Plc – L&G Gold Mining UCITS ETF | 47.95% | 33.42% |
| IAUP | iShares V Public Limited Company – iShares Gold Producers UCITS ETF | 46.99% | 31.96% |
| 0LKC | VanEck ETF Trust – VanEck Gold Miners ETF | 46.42% | 31.36% |
| JEDI | Vaneck Vectors UCITS ETFs PLC – Vaneck Vectors Space Innovators UCITS ETF | 46.39% | 29.64% |
| 0MUD | Multi Units Luxembourg – Amundi Daily LevDAX UCITS ETF | 46.27% | 29.46% |
| GDX | VanEck UCITS ETFs plc – VanEck Gold Miners UCITS ETF | 46.09% | 32.55% |
| XLDX | Xtrackers – LevDAX Daily Swap UCITS ETF | 45.91% | 28.84% |
Figure 1 below shows the 20 LSE ETFs listed above plotted by their CAGR and volatility. You can explore these and other securities in Diversiview, and see a number of past and expected performance indicators including expected return based on historical data and expected return based on the CAPM model.
A View of the Top 20 LSE-listed ETFs with Highest CAGR (3yr)
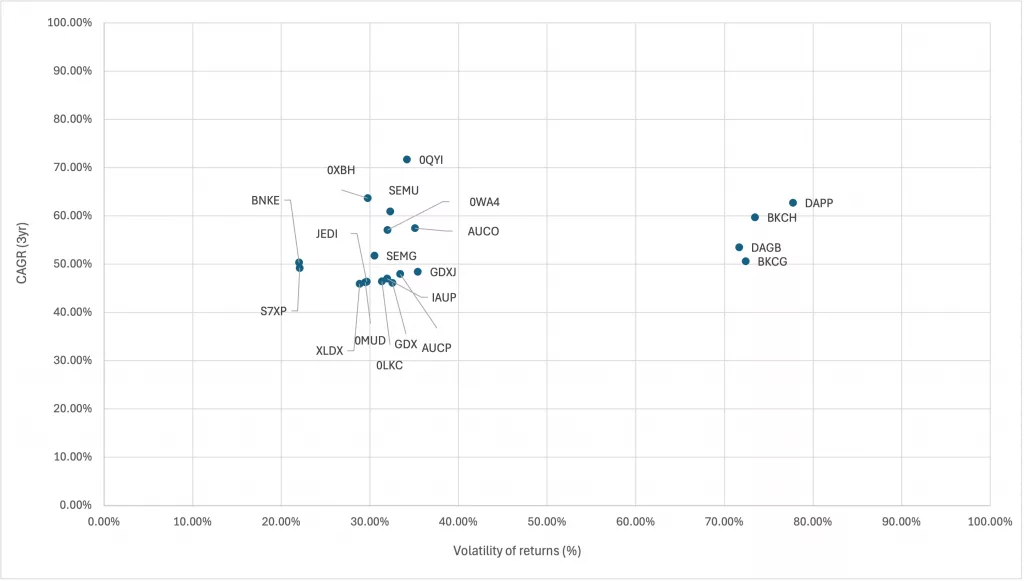
As it can be noticed in Figure 1, two groups have formed from this list, where the ETFs in the group to the right has similar CAGR as the ETFs in the group to the left, but for a much higher, even double, volatility. That is explained by those ETFs being crypto and blockchain related.
Diversiview supports your investment research – explore more securities in Diversiview, from any of the markets we cover, and see their expected and past performance indicators. You can do that for free, by going to top menu –> Resources –> Explore securities.
Get updated results
The list above was valid as at 23 October 2025. You can always find the latest ETFs rankings in StockLenz – the quant driven investment research app.
Install StockLenz today and run a search – it takes just seconds, freeing up your time to focus on further investment research and comparisons.
You can also save your favourites to your Diversiview account for further analysis.

NOTE: This article is not investment advice and does not constitute a recommendation to invest in any of the securities mentioned above. StockLenz is a quant driven research tool and the results will differ based on the data available, your filters and other indicators such as risk-free rates of return at the time of search. Please do your own research and/or speak with your financial advisor before making changes to your portfolio. Past performance does not guarantee future performance, and all investments carry a level of risk.
Disclaimer:
LENSELL GROUP Pty Ltd, ACN 646 467 941, trading as LENSELL, is a Corporate Authorised Representative of Foresight Analytics & Ratings Pty Ltd ( Australian Financial Services Licence No. 494552). All information provided to you by LENSELL is intended for general informational purposes only. It does not consider your individual financial circumstances and should not be relied upon without consulting a licensed investment professional or adviser.
The content on this website and in any of its applications is not a financial offer, recommendation, or advice to engage in any transaction. Investment products referenced in our software or marketing literature carry inherent risks, and you should note that past performance does not guarantee any future results. In all our modelling, no transaction costs or management fees are factored into performance analysis.
The information on our website or our mobile application is not intended to be an inducement, offer or solicitation to anyone in any jurisdiction in which LENSELL is not regulated or able to market its services.
Furthermore, all information used across our platform or website may be based on sources deemed reliable but is provided “as is” without guarantees of accuracy or updates. LENSELL and Foresight Analytics & Ratings disclaim all warranties and accepts no liability for any loss or damage resulting from use or reliance on any material or data embedded in our technology platform or digital media. Where liability cannot be excluded by law, it is limited to resupplying the information.
Please view our Financial Services Guide, Terms Of Service and Privacy Policy before making any investment decision using the information available on our website or on any of our applications. LENSELL, Diversiview and StockLenz are trademarks registered in Australia.