If you’ve typed “best stock screener,” “free stock screener app,” or “how to find stocks to buy” into Google, you’re likely facing the same problem as most investors: There are simply too many choices.
Thousands of listed stocks. Hundreds of ETFs. Multiple global markets. Different sectors, factors, and risk profiles.
A stock screener solves this problem by acting as a powerful stock filtering tool — allowing you to narrow the market to securities that match your exact criteria. But not all screeners are equal.
Let’s break down how investors use stock screeners — and how to choose the best stock screener for serious investing.
What Is a Stock Screener?
A stock screener is an online stock analysis tool that allows you to filter and rank securities using financial, performance, and risk metrics.
Instead of manually reviewing charts and financial statements, you can apply filters such as:
- Market capitalisation
- Sector or industry
- Dividend yield
- Valuation ratios
- Historical return
- Volatility
- Risk-adjusted performance
In seconds, a stock screener reduces thousands of stocks to a focused shortlist. For ETF investors, an ETF screener works the same way – enabling comparison across funds by return, volatility, and structure.`
Why Investors Use a Stock Screener
1. To Find Stocks That Match a Strategy
Every investor has a goal:
- Find undervalued stocks
- Identify high-growth companies
- Screen dividend stocks
- Locate lower-risk investments
- Compare ETFs for asset allocation
A stock screener turns these goals into measurable filters.
For example:
- Looking for value? Filter by lower P/E or price-to-book ratios.
- Want growth? Screen by historical return or earnings expansion.
- Prefer lower risk? Filter by volatility or beta.
This structured approach removes guesswork and improves consistency.
2. To Compare Risk vs Return
One of the most common investing mistakes is focusing only on performance. A 20% return means little if volatility is extreme. The best stock screeners include risk metrics such as:
- Sharpe ratio
- Beta
- Historical volatility
- Maximum drawdown
These metrics help investors compare stocks and ETFs on a risk-adjusted basis — not just headline returns.
If you’re searching for the “best performing stocks,” you should also be searching for the most efficient performers.
3. To Discover Opportunities Outside the Obvious
Many investors repeatedly analyse the same large-cap stocks. A stock screener allows you to:
- Explore mid-cap and small-cap stocks
- Identify outperformers within a sector
- Compare global stocks across exchanges
- Screen ETFs by asset class or geography
This broadens opportunity and reduces concentration risk.
4. To Save Time
Manual stock research can take hours. A stock screener app automates:
- Data comparison
- Ranking
- Filtering
- Shortlist creation
Instead of analysing everything, you analyse what already meets your standards.
Efficiency matters — especially for active investors or advisers reviewing multiple portfolios.
What Makes the Best Stock Screener?
When comparing stock screeners, look beyond “free” versus “paid.” Focus on functionality.
Here’s what serious investors should prioritise.
Multi-Factor Ranking
Basic screeners only filter. Advanced screeners rank stocks using multiple factors at once — combining expected return, volatility, and risk measures into a structured comparison. Multi-factor analysis is essential if you want more than just a filtered list.
ETF Screening Capability
If you build diversified portfolios, you need more than a stock screener. An ETF screener should allow you to:
- Rank ETFs by risk-adjusted return
- Compare volatility
- Evaluate global exposure
- Identify lower-risk alternatives
This is particularly useful for long-term portfolio construction.
Global Market Access
The best stock screener platforms allow screening across multiple countries. Global screening helps investors:
- Reduce home bias
- Identify stronger-performing regions
- Compare similar companies internationally
Limiting analysis to one market restricts opportunity.
Clear Risk Metrics
Avoid screeners that only highlight price changes. Look for tools that display:
- Volatility
- Beta relative to benchmarks
- Sharpe ratio
- Historical drawdowns
Serious investing requires understanding both upside potential and downside risk.
Transparent Methodology
A trustworthy stock analysis tool should clearly explain:
- How returns are calculated
- What timeframes are used
- How volatility is measured
Transparency supports better decision-making.
Clean User Interface
The best stock screener app is one you’ll actually use. Look for:
- Clear ranking tables
- Logical filter layout
- Easy export or Save Portfolio functionality
- Mobile compatibility
A complicated interface discourages consistent use.
Choosing the Right Stock Screening Tool
If your goal is simply to browse stocks casually, a free stock screener may be enough. But if you are building portfolios, comparing ETFs, or making risk-aware investment decisions, you need:
- Multi-factor ranking
- Risk-adjusted analysis
- Global market coverage
- Clear data transparency
A high-quality stock screener doesn’t tell you what to buy. It helps you make better, more disciplined decisions.
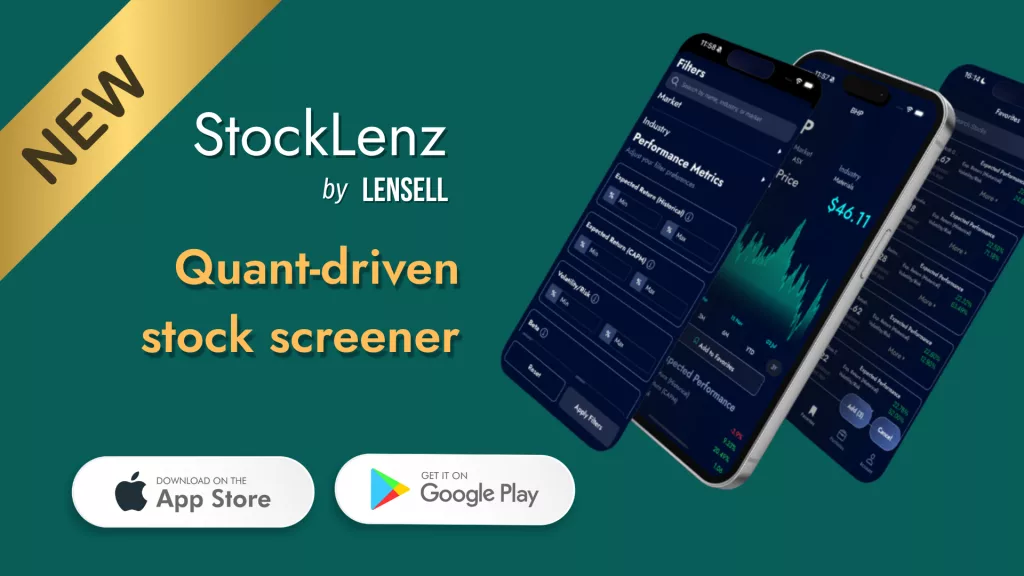
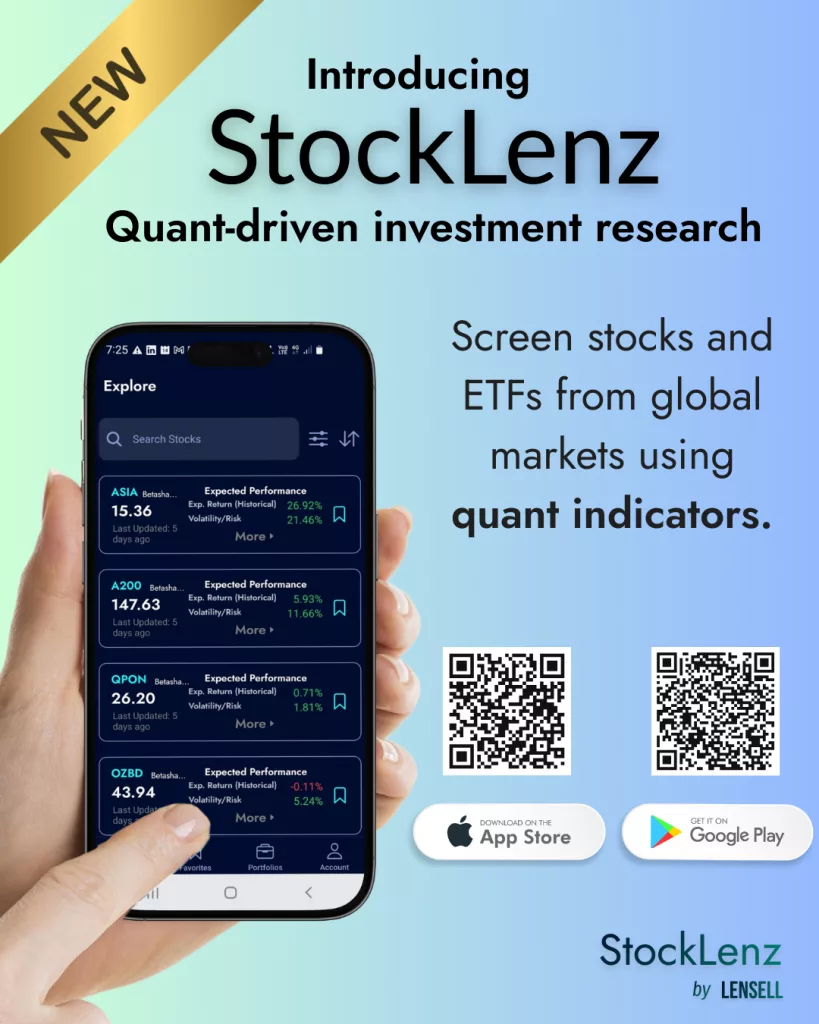
StockLenz is built as a quant-driven stock and ETF screener across several global markets*, helping serious investors rank opportunities by expected return, volatility, and risk-adjusted performance in one structured app.
* It covers all listed securities on the ASX (Australian Stock Exchange), NASDAQ, NYSE (New York Stock Exchange), BSE (Bombay Stock Exchange), NSE (National Stock Exchange of India), HKEX (Hong Kong Stock Exchange), LSE (London Stock Exchange), and DFM (Dubai Financial Market). It also covers all Mutual Funds schemes in India.
Get it now from Apple App Store or Google Play Store (QR codes below).
Disclaimer:
LENSELL GROUP Pty Ltd, ACN 646 467 941, trading as LENSELL, is a Corporate Authorised Representative of Foresight Analytics & Ratings Pty Ltd ( Australian Financial Services Licence No. 494552). All information provided to you by LENSELL is intended for general informational purposes only. It does not consider your individual financial circumstances and should not be relied upon without consulting a licensed investment professional or adviser.
The content on this website and in any of its applications is not a financial offer, recommendation, or advice to engage in any transaction. Investment products referenced in our software or marketing literature carry inherent risks, and you should note that past performance does not guarantee any future results. In all our modelling, no transaction costs or management fees are factored into performance analysis.
The information on our website or our mobile application is not intended to be an inducement, offer or solicitation to anyone in any jurisdiction in which LENSELL is not regulated or able to market its services.
Furthermore, all information used across our platform or website may be based on sources deemed reliable but is provided “as is” without guarantees of accuracy or updates. LENSELL and Foresight Analytics & Ratings disclaim all warranties and accepts no liability for any loss or damage resulting from use or reliance on any material or data embedded in our technology platform or digital media. Where liability cannot be excluded by law, it is limited to resupplying the information.
Please view our Financial Services Guide, Terms Of Service and Privacy Policy before making any investment decision using the information available on our website or on any of our applications. LENSELL, Diversiview and TableBits are trademarks registered in Australia.