This list is compiled based on indicators as at 17 November 2025, and it lists 20 stocks listed on the Dubai Financial Market with some of their past performance (CAGR, volatility) and expected performance indicators. Only stocks with a history older than 3 years have been included, which may explain why some known names are not in the list. Also, indicators are based on the original raw price data in AED.
DFM’s Top 20 Performers
Explore more about each stock by clicking on the ticker link. This is not financial advice but factual representation of the calculated performance, that you are welcome to use in your research.
| TICKER | NAME | EXPECTED RETURN (HISTORICAL) | EXPECTED RETURN (CAPM) | CAGR | VARIABILITY OF RETURNS |
| EKTTITAB | EKTTITAB HOLDING CO SAK | 81.53% | 6.44% | 79.40% | 56.20% |
| EMAARDEV | EMAAR DEVELOPMENT PJSC | 49.39% | 13.54% | 49.71% | 33.03% |
| UPP | UNION PROPERTIES PJSC | 45.87% | 9.92% | 45.65% | 39.74% |
| AMLAK | AMLAK FINANCE | 38.45% | 10.05% | 38.87% | 40.89% |
| SALIK | SALIK CO PJSC | 37.91% | 8.52% | 38.39% | 25.04% |
| MASQ | MASHREQBANK | 36.07% | 8.41% | 34.48% | 32.02% |
| ALFIRDOUS | AL FIRDOUS HOLDINGS PJSC | 32.99% | 7.49% | 32.69% | 63.89% |
| EMAAR | EMAAR PROPERTIES PJSC | 30.68% | 12.95% | 30.87% | 28.03% |
| AJMANBANK | AJMAN BANK PJSC | 30.41% | 6.78% | 30.51% | 27.27% |
| CBD | COMMERCIAL BANK OF DUBAI | 30.93% | 9.91% | 30.10% | 38.89% |
| GFH | GFH FINANCIAL GROUP BSC | 29.56% | 7.37% | 29.83% | 27.71% |
| DEYAAR | DEYAAR DEVELOPMENT PJSC | 25.11% | 9.68% | 25.26% | 27.67% |
| EMIRATESNBD | EMIRATES NBD PJSC | 24.75% | 10.69% | 24.94% | 24.86% |
| AIRARABIA | AIR ARABIA PJSC | 23.23% | 9.53% | 23.43% | 22.72% |
| DIN | DUBAI INSURANCE CO. (P.S.C.) | 28.60% | 5.41% | 22.91% | 28.71% |
| NCC | NATIONAL CEMENT CO | 25.78% | 6.18% | 21.97% | 50.65% |
| DU | EMIRATES INTEGRATED TELECOMM | 19.52% | 6.94% | 19.66% | 16.60% |
| TAALEEM | TAALEEM HOLDINGS PSC | 17.75% | 6.47% | 17.87% | 26.06% |
| DIB | DUBAI ISLAMIC BANK | 17.04% | 9.40% | 17.16% | 18.60% |
| ITHMR | ITHMAAR HOLDING BSC | 15.38% | 7.31% | 15.42% | 44.98% |
| DFMGI | DFM INDEX | 21.76% | 9.54% | 21.44% | 10.81% |
Figure 1 below plots the 20 stocks by CAGR and Variability of returns (blue points) and the DFMGI index (orange point).
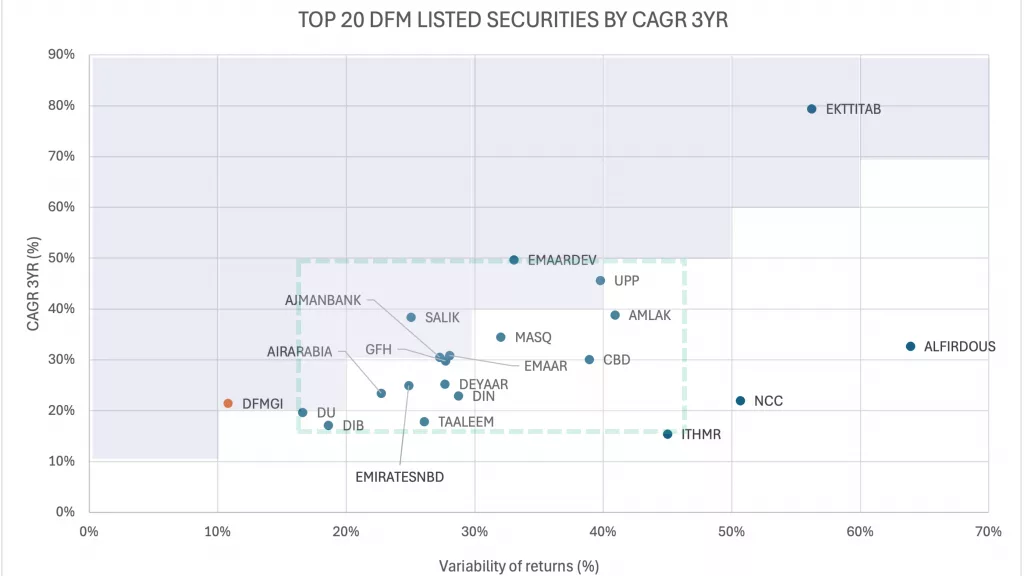
We believe that past performance is not a guarantee of future performance, but one should also look at volatility of the past returns to understand how much risk they may take with any of those investments.
So, what do we learn from the Top 20 DFM stocks graph?
As one can easily notice:
- All 20 stocks are riskier than the index DFMGI (i.e. they have a higher volatility of returns).
- Some of the stocks had a lower CAGR during the past 3 years compared with the index DFMGI, for a much higher risk (for example, DU, DIB, TAALEEM or ITHMR).
- All but 3 stocks are grouped in a rough box of 15% – 50% CAGR and 15% – 45% volatility (see the area within the green dotted line on the graph).
- ALFIRDOUS (Al Firdous Holdings) has the highest volatility, which may be explained by the dramatic increase in value around June 2023. However, since Feb 2024 the stock seems to hover in a narrow price range without a lot of volatility.
Ideal Performance – How to Spot It
You may wonder what is with the mauve areas on the graph. Those are areas where you would like your investments to be – that is, ideally, your investments have a return greater than the volatility so when the stock price falls you do not lose all the gains made during the grow periods. For example, you’d want a stock that have 20% volatility of returns to have more than 20% CAGR (or, if you speak in expected performance terms, more than 20% expected return). In the opposite scenario (i.e. volatility > return) it means you take extra risk and increase the potential size of loss during downtime but not for extra return.
As it can be noticed on the graph, only four DFM stocks (from our list of 20) were clearly in the mauve area (EKTTITAB, SALIK, UPP and EMAARDEV), with some more stocks on the edge, almost there (AKMANBANK, EMAAR, GFH and DU). The remaining 12 stocks were well out of the ‘ideal’ area, meaning that investors took more risk for the compound annual return they obtained on those investments.
For an even more accurate representation of the risk-adjusted returns, one can explore each stock and see the calculated Sharpe ratios for each.
Disclaimer:
LENSELL GROUP Pty Ltd, ACN 646 467 941, trading as LENSELL, is a Corporate Authorised Representative of Foresight Analytics & Ratings Pty Ltd ( Australian Financial Services Licence No. 494552). All information provided to you by LENSELL is intended for general informational purposes only. It does not consider your individual financial circumstances and should not be relied upon without consulting a licensed investment professional or adviser.
The content on this website and in any of its applications is not a financial offer, recommendation, or advice to engage in any transaction. Investment products referenced in our software or marketing literature carry inherent risks, and you should note that past performance does not guarantee any future results. In all our modelling, no transaction costs or management fees are factored into performance analysis.
The information on our website or our mobile application is not intended to be an inducement, offer or solicitation to anyone in any jurisdiction in which LENSELL is not regulated or able to market its services.
Furthermore, all information used across our platform or website may be based on sources deemed reliable but is provided “as is” without guarantees of accuracy or updates. LENSELL and Foresight Analytics & Ratings disclaim all warranties and accepts no liability for any loss or damage resulting from use or reliance on any material or data embedded in our technology platform or digital media. Where liability cannot be excluded by law, it is limited to resupplying the information.
Please view our Financial Services Guide, Terms Of Service and Privacy Policy before making any investment decision using the information available on our website or on any of our applications. LENSELL, Diversiview and TableBits are trademarks registered in Australia.