The list and graph below show some examples of Indian stocks and ETFs listed on the BSE (Bombay Stock Exchange) and NSE (National Stock Exchange of India), that outperformed NIFTY 50 and SENSEX during the past 3 years. Indicators are valid as at 10 November 2025.
Note that to allow for fair comparison, only securities with 3 years history have been included in this list. The list is not exhaustive, as other securities that fit the criteria of outperformance may exist.
*CAGR = Compound Annual Growth Rate
OUTPERFORMING INDIAN STOCKS AND ETFs
| Ticker | Name | CAGR (%) | Volatility (%) |
| 522275 | GE T&D India Limited | 185.19% | 48.63% |
| V2RETAIL | V2 Retail Ltd Ordinary Shares | 181.77% | 45.92% |
| SPECTRUM | Spectrum Electrical Industries Ltd. Ordinary Shares | 176.44% | 56.14% |
| SOMATEX | Soma Textiles & Industries Ltd. Ordinary Shares | 172.15% | 61.60% |
| NPST | Network People Services Technologies Ltd. Ordinary Shares | 150.12% | 78.47% |
| VIVIANA | Viviana Power Tech Ltd. Ordinary Shares | 148.56% | 58.22% |
| VMARCIND | V-Marc India Ltd. Ordinary Shares | 145.13% | 59.38% |
| E2E | E2E Networks Ltd. Ordinary Shares | 143.82% | 52.56% |
| S&SPOWER | S&S Power Switchgear Ltd. Ordinary Shares | 143.55% | 47.43% |
| WEBELSOLAR | Websol Energy System Ltd Ordinary Shares | 142.80% | 61.84% |
| ELECTHERM | Electrotherm (India) Ltd. Ordinary Shares | 140.41% | 50.58% |
| 512463 | Shree Global Tradefin L t d.. | 139.58% | 58.67% |
| 500033 | Force Motors Limited | 136.13% | 52.47% |
| 524558 | Neuland Laboratories Limited. | 131.94% | 53.03% |
| 539177 | Authum Investment & Infrastructure Limited | 129.54% | 56.78% |
| 531112 | BALU FORGE INDUSTRIES LIMITED | 113.77% | 56.88% |
| 543664 | KAYNES TECHNOLOGY INDIA LIMITED | 111.78% | 46.10% |
| 517271 | HBL Power Systems Ltd. | 107.03% | 48.26% |
| 532726 | GALLANTT ISPAT LIMITED | 101.54% | 46.76% |
| 505714 | Gabriel India Ltd. | 98.48% | 43.98% |
| GOLDSHARE | UTI Gold ETF | 32.35% | 13.08% |
| SETFGOLD | SBI Gold Exchange Traded Scheme | 31.88% | 13.13% |
| HDFCGOLD | HDFC Gold ETF | 31.85% | 13.00% |
| QGOLDHALF | Quantum Gold Fund | 31.84% | 13.22% |
| GOLDBEES | Nippon India ETF Gold BeES | 31.60% | 13.50% |
| DIVOPPBEES | Nippon India ETF Nifty Dividend Opportunities 50 | 19.10% | 13.06% |
| SBIETFCON | SBI ETF Consumption | 16.95% | 12.03% |
| CONSUMBEES | Nippon India ETF Nifty India Consumption | 16.63% | 11.06% |
| NIFTY | NIFTY 50 INDEX | 13.80% | 11.89% |
| SENSEX | SENSEX INDEX | 12.23% | 11.83% |
As Figure 2 clearly shows (and as one may expect) the outperforming ETFs have a much lower of volatility of returns, while the group of outperforming stocks examples have a high-return, high risk profile. Moreover, it can be noticed that for similar levels of risk (e.g. volatility between 50-60%) different stocks had different levels of CAGR.
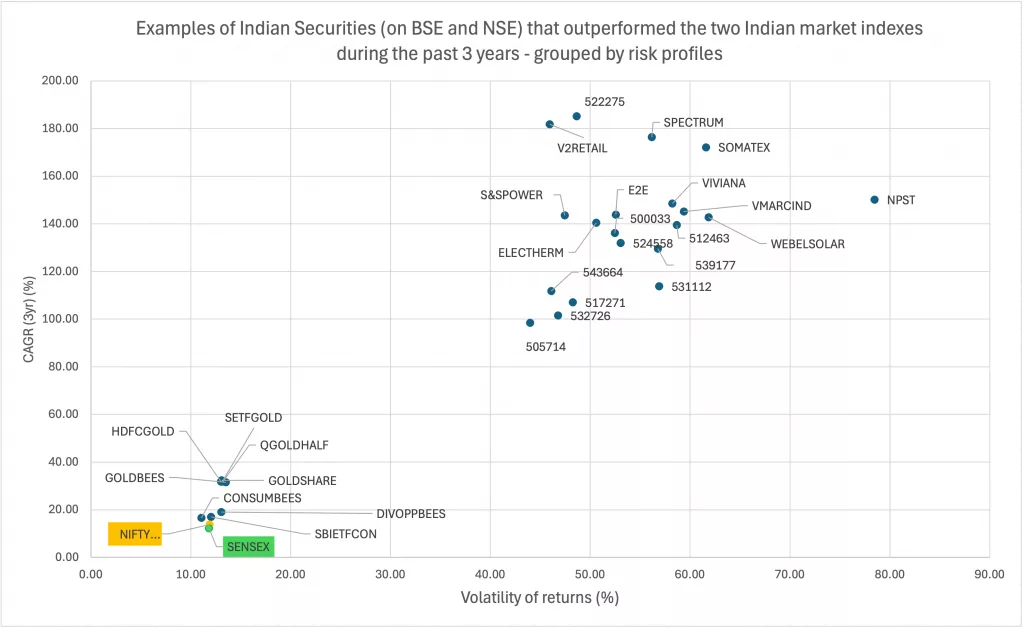
The point is, you can always find securities that outperform the market (and may – or may not – outperform it in the future as well), but one should always pay attention to the level of risk (as volatility of returns) they would take for the level of returns they would expect.
HOW TO FIND OUTPERFORMING SECURITIES?
Diversiview by LENSELL covers both BSE and NSE markets (see all markets available). You can find securities that fit a specific risk-return criteria (like in our example, outperforming a certain index) using the filters available when you build a new portfolio.
Thinking to invest in the Indian market?
LENSELL Portfolio Strategies include India-focused ETFs and are optimised to ensure the lowest volatility for the best expectation of returns – coming soon to the LENSELL Marketplace!
Disclaimer:
LENSELL GROUP Pty Ltd, ACN 646 467 941, trading as LENSELL, is a Corporate Authorised Representative of Foresight Analytics & Ratings Pty Ltd ( Australian Financial Services Licence No. 494552). All information provided to you by LENSELL is intended for general informational purposes only. It does not consider your individual financial circumstances and should not be relied upon without consulting a licensed investment professional or adviser.
The content on this website and in any of its applications is not a financial offer, recommendation, or advice to engage in any transaction. Investment products referenced in our software or marketing literature carry inherent risks, and you should note that past performance does not guarantee any future results. In all our modelling, no transaction costs or management fees are factored into performance analysis.
The information on our website or our mobile application is not intended to be an inducement, offer or solicitation to anyone in any jurisdiction in which LENSELL is not regulated or able to market its services.
Furthermore, all information used across our platform or website may be based on sources deemed reliable but is provided “as is” without guarantees of accuracy or updates. LENSELL and Foresight Analytics & Ratings disclaim all warranties and accepts no liability for any loss or damage resulting from use or reliance on any material or data embedded in our technology platform or digital media. Where liability cannot be excluded by law, it is limited to resupplying the information.
Please view our Financial Services Guide, Terms Of Service and Privacy Policy before making any investment decision using the information available on our website or on any of our applications. LENSELL, Diversiview and TableBits are trademarks registered in Australia.